library(SeroTrackR)
library(tidyverse)

your_raw_LDH_data         <- system.file("extdata", "example_BioPlex_PvLDH_plate1.xlsx", package = "SeroTrackR")
your_LDH_plate_layout <- system.file("extdata", "example_platelayout_1.xlsx", package = "SeroTrackR")3 PvLDH Tutorial
For the PvLDH data analysis, follow the steps below:
3.1 Using Tutorial Dataset: Load the Data
We will be using the build-in files in the R package for this tutorial, as shown below.
To run your OWN data, follow the code below:
your_raw_LDH_data       <- "PATH/TO/YOUR/FILE/plate1.xlsx"
your_LDH_plate_layout   <- "PATH/TO/YOUR/FILE/plate_layout.xlsx"
3.2 Step 1: Read in your data
NoteData preparation
Please ensure that you have read and prepared your raw Luminex files and plate layout files as per the instructions in the Before You Begin page.
You can read any Luminex serology data file using the readSeroData() function. The Luminex platform can be specified using the platform argument, with either bioplex, magpix or intelliflex.
For the xPONENT software-based exported files (MAGPIX or INTELLIFLEX), the version of the software should be specified as either “4.2” or “4.3”, with the version “4.2” as the default.
ldh_sero_data <- readSeroData(
  raw_data = your_raw_LDH_data,
  platform = "bioplex"
)
#> PASS: File example_bioplex_pvldh_plate1.xlsx successfully validated.ldh_sero_data$ data_raw
| RunColumn | …2 | …3 | …4 | …5 | …6 | …7 | …8 | Plate |
|---|---|---|---|---|---|---|---|---|
| Acquisition Date: 01-Jan-2025, 11:11 AM | NA | NA | NA | NA | NA | NA | NA | plate1 |
| Reader Serial Number: LX10014219408 | NA | NA | NA | NA | NA | NA | NA | plate1 |
| RP1 PMT (Volts): 538.22 | NA | NA | NA | NA | NA | NA | NA | plate1 |
| RP1 Target: 3698 | NA | NA | NA | NA | NA | NA | NA | plate1 |
| Plate ID: | NA | NA | NA | NA | NA | NA | NA | plate1 |
| NA | NA | NA | NA | NA | NA | NA | NA | plate1 |
| Well | Type | PvLDH-ST (38) | Region | Gate | Total | % Agg Beads | Sampling Errors | plate1 |
| A1 | B | 29.0 (50) | 50 | 55 | 62 | 11 | NA | plate1 |
| B1 | X13 | 54.5 (50) | 50 | 57 | 65 | 12 | NA | plate1 |
| C1 | X25 | 29.0 (50) | 50 | 53 | 57 | 7 | NA | plate1 |
| D1 | X37 | 32.5 (50) | 50 | 65 | 85 | 24 | NA | plate1 |
| E1 | X49 | 25.5 (50) | 50 | 54 | 60 | 10 | NA | plate1 |
| F1 | X61 | 25.5 (50) | 50 | 58 | 70 | 17 | NA | plate1 |
| G1 | X73 | 25.5 (50) | 50 | 52 | 59 | 12 | NA | plate1 |
| H1 | X85 | 26.5 (50) | 50 | 62 | 68 | 9 | NA | plate1 |
| A2 | B | 28.0 (50) | 50 | 55 | 68 | 19 | NA | plate1 |
| B2 | X14 | 28.5 (50) | 50 | 56 | 67 | 16 | NA | plate1 |
| C2 | X26 | 48.5 (50) | 50 | 54 | 64 | 16 | NA | plate1 |
| D2 | X38 | 34.0 (50) | 50 | 55 | 57 | 4 | NA | plate1 |
| E2 | X50 | 32.0 (50) | 50 | 53 | 65 | 18 | NA | plate1 |
| F2 | X62 | 33.5 (50) | 50 | 55 | 65 | 15 | NA | plate1 |
| G2 | X74 | 28.5 (50) | 50 | 52 | 61 | 15 | NA | plate1 |
| H2 | X86 | 32.0 (50) | 50 | 52 | 61 | 15 | NA | plate1 |
| A3 | S1 | 23757.0 (50) | 50 | 56 | 68 | 18 | NA | plate1 |
| B3 | X15 | 33.5 (50) | 50 | 50 | 63 | 21 | NA | plate1 |
| C3 | X27 | 41.0 (50) | 50 | 55 | 63 | 13 | NA | plate1 |
| D3 | X39 | 25.5 (50) | 50 | 58 | 76 | 24 | NA | plate1 |
| E3 | X51 | 81.5 (50) | 50 | 57 | 64 | 11 | NA | plate1 |
| F3 | X63 | 31.0 (50) | 50 | 57 | 64 | 11 | NA | plate1 |
| G3 | X75 | 31.0 (50) | 50 | 57 | 63 | 10 | NA | plate1 |
| H3 | X87 | 26.0 (50) | 50 | 54 | 61 | 11 | NA | plate1 |
| A4 | S2 | 22604.5 (50) | 50 | 55 | 65 | 15 | NA | plate1 |
| B4 | X16 | 32.0 (50) | 50 | 57 | 81 | 30 | NA | plate1 |
| C4 | X28 | 52.0 (50) | 50 | 57 | 68 | 16 | NA | plate1 |
| D4 | X40 | 35.0 (50) | 50 | 55 | 61 | 10 | NA | plate1 |
| E4 | X52 | 29.5 (50) | 50 | 54 | 64 | 16 | NA | plate1 |
| F4 | X64 | 36.5 (50) | 50 | 53 | 62 | 15 | NA | plate1 |
| G4 | X76 | 30.0 (50) | 50 | 54 | 59 | 8 | NA | plate1 |
| H4 | X88 | 35.0 (50) | 50 | 55 | 63 | 13 | NA | plate1 |
| A5 | S3 | 12532.0 (50) | 50 | 55 | 60 | 8 | NA | plate1 |
| B5 | X17 | 33.0 (50) | 50 | 56 | 76 | 26 | NA | plate1 |
| C5 | X29 | 29.0 (45) | *45 | 55 | 72 | 24 | NA | plate1 |
| D5 | X41 | 73.5 (30) | *30 | 42 | 48 | 13 | NA | plate1 |
| E5 | X53 | 25.0 (50) | 50 | 54 | 65 | 17 | NA | plate1 |
| F5 | X65 | 22.0 (50) | 50 | 53 | 61 | 13 | NA | plate1 |
| G5 | X77 | 27.0 (50) | 50 | 53 | 60 | 12 | NA | plate1 |
| H5 | X89 | 24.0 (50) | 50 | 56 | 60 | 7 | NA | plate1 |
| A6 | S4 | 4441.5 (50) | 50 | 55 | 71 | 23 | NA | plate1 |
| B6 | X18 | 30.0 (50) | 50 | 59 | 68 | 13 | NA | plate1 |
| C6 | X30 | 28.5 (50) | 50 | 51 | 55 | 7 | NA | plate1 |
| D6 | X42 | 22.0 (50) | 50 | 53 | 57 | 7 | NA | plate1 |
| E6 | X54 | 42.0 (50) | 50 | 51 | 56 | 9 | NA | plate1 |
| F6 | X66 | 39.0 (50) | 50 | 56 | 62 | 10 | NA | plate1 |
| G6 | X78 | 33.0 (50) | 50 | 56 | 63 | 11 | NA | plate1 |
| H6 | X90 | 64.0 (46) | *46 | 52 | 72 | 28 | NA | plate1 |
| A7 | S5 | 1302.5 (50) | 50 | 58 | 73 | 21 | NA | plate1 |
| B7 | X19 | 15646.5 (50) | 50 | 61 | 75 | 19 | NA | plate1 |
| C7 | X31 | 38.0 (50) | 50 | 56 | 62 | 10 | NA | plate1 |
| D7 | X43 | 28.5 (50) | 50 | 57 | 67 | 15 | NA | plate1 |
| E7 | X55 | 46.5 (50) | 50 | 64 | 72 | 11 | NA | plate1 |
| F7 | X67 | 37.5 (50) | 50 | 52 | 57 | 9 | NA | plate1 |
| G7 | X79 | 27.5 (50) | 50 | 54 | 62 | 13 | NA | plate1 |
| H7 | X91 | 33.5 (50) | 50 | 57 | 67 | 15 | NA | plate1 |
| A8 | S6 | 384.5 (50) | 50 | 54 | 71 | 24 | NA | plate1 |
| B8 | X20 | 40.0 (50) | 50 | 56 | 68 | 18 | NA | plate1 |
| C8 | X32 | 27.5 (50) | 50 | 58 | 70 | 17 | NA | plate1 |
| D8 | X44 | 35.5 (50) | 50 | 56 | 62 | 10 | NA | plate1 |
| E8 | X56 | 29.0 (50) | 50 | 64 | 80 | 20 | NA | plate1 |
| F8 | X68 | 36.0 (50) | 50 | 59 | 73 | 19 | NA | plate1 |
| G8 | X80 | 36.0 (50) | 50 | 52 | 62 | 16 | NA | plate1 |
| H8 | X92 | 31.5 (50) | 50 | 57 | 62 | 8 | NA | plate1 |
| A9 | S7 | 144.0 (50) | 50 | 52 | 59 | 12 | NA | plate1 |
| B9 | X21 | 46.5 (50) | 50 | 53 | 60 | 12 | NA | plate1 |
| C9 | X33 | 40.0 (50) | 50 | 57 | 67 | 15 | NA | plate1 |
| D9 | X45 | 24.0 (50) | 50 | 57 | 69 | 17 | NA | plate1 |
| E9 | X57 | 24.0 (50) | 50 | 56 | 63 | 11 | NA | plate1 |
| F9 | X69 | 22.0 (50) | 50 | 54 | 69 | 22 | NA | plate1 |
| G9 | X81 | 22.0 (50) | 50 | 59 | 68 | 13 | NA | plate1 |
| H9 | X93 | 27.0 (50) | 50 | 52 | 68 | 24 | NA | plate1 |
| A10 | S8 | 60.0 (50) | 50 | 58 | 68 | 15 | NA | plate1 |
| B10 | X22 | 32.0 (50) | 50 | 54 | 61 | 11 | NA | plate1 |
| C10 | X34 | 23.0 (50) | 50 | 55 | 64 | 14 | NA | plate1 |
| D10 | X46 | 98.0 (40) | *40 | 55 | 72 | 24 | NA | plate1 |
| E10 | X58 | 37.0 (50) | 50 | 53 | 59 | 10 | NA | plate1 |
| F10 | X70 | 30.0 (50) | 50 | 54 | 57 | 5 | NA | plate1 |
| G10 | X82 | 30.0 (50) | 50 | 52 | 59 | 12 | NA | plate1 |
| H10 | X94 | 24.0 (50) | 50 | 63 | 70 | 10 | NA | plate1 |
| A11 | S9 | 35.5 (50) | 50 | 58 | 68 | 15 | NA | plate1 |
| B11 | X23 | 33.5 (50) | 50 | 57 | 68 | 16 | NA | plate1 |
| C11 | X35 | 32.0 (47) | *47 | 63 | 72 | 13 | NA | plate1 |
| D11 | X47 | 26.0 (50) | 50 | 55 | 58 | 5 | NA | plate1 |
| E11 | X59 | 37.5 (50) | 50 | 55 | 67 | 18 | NA | plate1 |
| F11 | X71 | 32.0 (50) | 50 | 54 | 56 | 4 | NA | plate1 |
| G11 | X83 | 24.5 (50) | 50 | 55 | 61 | 10 | NA | plate1 |
| H11 | X95 | 34.5 (50) | 50 | 51 | 59 | 14 | NA | plate1 |
| A12 | S10 | 30.0 (50) | 50 | 58 | 65 | 11 | NA | plate1 |
| B12 | X24 | 114.0 (50) | 50 | 55 | 72 | 24 | NA | plate1 |
| C12 | X36 | 26.0 (50) | 50 | 55 | 58 | 5 | NA | plate1 |
| D12 | X48 | 33.0 (50) | 50 | 55 | 64 | 14 | NA | plate1 |
| E12 | X60 | 32.5 (50) | 50 | 53 | 58 | 9 | NA | plate1 |
| F12 | X72 | 26.0 (50) | 50 | 53 | 57 | 7 | NA | plate1 |
| G12 | X84 | 31.0 (50) | 50 | 55 | 65 | 15 | NA | plate1 |
| H12 | X96 | 27.5 (50) | 50 | 54 | 64 | 16 | NA | plate1 |
$ results
| Location | Sample | PvLDH-ST | Plate |
|---|---|---|---|
| 1(1,A1) | Blank1 | 29.0 | plate1 |
| 2(1,A2) | Blank2 | 28.0 | plate1 |
| 3(1,A3) | S1 | 23757.0 | plate1 |
| 4(1,A4) | S2 | 22604.5 | plate1 |
| 5(1,A5) | S3 | 12532.0 | plate1 |
| 6(1,A6) | S4 | 4441.5 | plate1 |
| 7(1,A7) | S5 | 1302.5 | plate1 |
| 8(1,A8) | S6 | 384.5 | plate1 |
| 9(1,A9) | S7 | 144.0 | plate1 |
| 10(1,A10) | S8 | 60.0 | plate1 |
| 11(1,A11) | S9 | 35.5 | plate1 |
| 12(1,A12) | S10 | 30.0 | plate1 |
| 13(1,B1) | X13 | 54.5 | plate1 |
| 14(1,B2) | X14 | 28.5 | plate1 |
| 15(1,B3) | X15 | 33.5 | plate1 |
| 16(1,B4) | X16 | 32.0 | plate1 |
| 17(1,B5) | X17 | 33.0 | plate1 |
| 18(1,B6) | X18 | 30.0 | plate1 |
| 19(1,B7) | X19 | 15646.5 | plate1 |
| 20(1,B8) | X20 | 40.0 | plate1 |
| 21(1,B9) | X21 | 46.5 | plate1 |
| 22(1,B10) | X22 | 32.0 | plate1 |
| 23(1,B11) | X23 | 33.5 | plate1 |
| 24(1,B12) | X24 | 114.0 | plate1 |
| 25(1,C1) | X25 | 29.0 | plate1 |
| 26(1,C2) | X26 | 48.5 | plate1 |
| 27(1,C3) | X27 | 41.0 | plate1 |
| 28(1,C4) | X28 | 52.0 | plate1 |
| 29(1,C5) | X29 | 29.0 | plate1 |
| 30(1,C6) | X30 | 28.5 | plate1 |
| 31(1,C7) | X31 | 38.0 | plate1 |
| 32(1,C8) | X32 | 27.5 | plate1 |
| 33(1,C9) | X33 | 40.0 | plate1 |
| 34(1,C10) | X34 | 23.0 | plate1 |
| 35(1,C11) | X35 | 32.0 | plate1 |
| 36(1,C12) | X36 | 26.0 | plate1 |
| 37(1,D1) | X37 | 32.5 | plate1 |
| 38(1,D2) | X38 | 34.0 | plate1 |
| 39(1,D3) | X39 | 25.5 | plate1 |
| 40(1,D4) | X40 | 35.0 | plate1 |
| 41(1,D5) | X41 | 73.5 | plate1 |
| 42(1,D6) | X42 | 22.0 | plate1 |
| 43(1,D7) | X43 | 28.5 | plate1 |
| 44(1,D8) | X44 | 35.5 | plate1 |
| 45(1,D9) | X45 | 24.0 | plate1 |
| 46(1,D10) | X46 | 98.0 | plate1 |
| 47(1,D11) | X47 | 26.0 | plate1 |
| 48(1,D12) | X48 | 33.0 | plate1 |
| 49(1,E1) | X49 | 25.5 | plate1 |
| 50(1,E2) | X50 | 32.0 | plate1 |
| 51(1,E3) | X51 | 81.5 | plate1 |
| 52(1,E4) | X52 | 29.5 | plate1 |
| 53(1,E5) | X53 | 25.0 | plate1 |
| 54(1,E6) | X54 | 42.0 | plate1 |
| 55(1,E7) | X55 | 46.5 | plate1 |
| 56(1,E8) | X56 | 29.0 | plate1 |
| 57(1,E9) | X57 | 24.0 | plate1 |
| 58(1,E10) | X58 | 37.0 | plate1 |
| 59(1,E11) | X59 | 37.5 | plate1 |
| 60(1,E12) | X60 | 32.5 | plate1 |
| 61(1,F1) | X61 | 25.5 | plate1 |
| 62(1,F2) | X62 | 33.5 | plate1 |
| 63(1,F3) | X63 | 31.0 | plate1 |
| 64(1,F4) | X64 | 36.5 | plate1 |
| 65(1,F5) | X65 | 22.0 | plate1 |
| 66(1,F6) | X66 | 39.0 | plate1 |
| 67(1,F7) | X67 | 37.5 | plate1 |
| 68(1,F8) | X68 | 36.0 | plate1 |
| 69(1,F9) | X69 | 22.0 | plate1 |
| 70(1,F10) | X70 | 30.0 | plate1 |
| 71(1,F11) | X71 | 32.0 | plate1 |
| 72(1,F12) | X72 | 26.0 | plate1 |
| 73(1,G1) | X73 | 25.5 | plate1 |
| 74(1,G2) | X74 | 28.5 | plate1 |
| 75(1,G3) | X75 | 31.0 | plate1 |
| 76(1,G4) | X76 | 30.0 | plate1 |
| 77(1,G5) | X77 | 27.0 | plate1 |
| 78(1,G6) | X78 | 33.0 | plate1 |
| 79(1,G7) | X79 | 27.5 | plate1 |
| 80(1,G8) | X80 | 36.0 | plate1 |
| 81(1,G9) | X81 | 22.0 | plate1 |
| 82(1,G10) | X82 | 30.0 | plate1 |
| 83(1,G11) | X83 | 24.5 | plate1 |
| 84(1,G12) | X84 | 31.0 | plate1 |
| 85(1,H1) | X85 | 26.5 | plate1 |
| 86(1,H2) | X86 | 32.0 | plate1 |
| 87(1,H3) | X87 | 26.0 | plate1 |
| 88(1,H4) | X88 | 35.0 | plate1 |
| 89(1,H5) | X89 | 24.0 | plate1 |
| 90(1,H6) | X90 | 64.0 | plate1 |
| 91(1,H7) | X91 | 33.5 | plate1 |
| 92(1,H8) | X92 | 31.5 | plate1 |
| 93(1,H9) | X93 | 27.0 | plate1 |
| 94(1,H10) | X94 | 24.0 | plate1 |
| 95(1,H11) | X95 | 34.5 | plate1 |
| 96(1,H12) | X96 | 27.5 | plate1 |
$ counts
| Location | Sample | PvLDH-ST | Plate |
|---|---|---|---|
| 1(1,A1) | Blank1 | 50 | plate1 |
| 2(1,A2) | Blank2 | 50 | plate1 |
| 3(1,A3) | S1 | 50 | plate1 |
| 4(1,A4) | S2 | 50 | plate1 |
| 5(1,A5) | S3 | 50 | plate1 |
| 6(1,A6) | S4 | 50 | plate1 |
| 7(1,A7) | S5 | 50 | plate1 |
| 8(1,A8) | S6 | 50 | plate1 |
| 9(1,A9) | S7 | 50 | plate1 |
| 10(1,A10) | S8 | 50 | plate1 |
| 11(1,A11) | S9 | 50 | plate1 |
| 12(1,A12) | S10 | 50 | plate1 |
| 13(1,B1) | X13 | 50 | plate1 |
| 14(1,B2) | X14 | 50 | plate1 |
| 15(1,B3) | X15 | 50 | plate1 |
| 16(1,B4) | X16 | 50 | plate1 |
| 17(1,B5) | X17 | 50 | plate1 |
| 18(1,B6) | X18 | 50 | plate1 |
| 19(1,B7) | X19 | 50 | plate1 |
| 20(1,B8) | X20 | 50 | plate1 |
| 21(1,B9) | X21 | 50 | plate1 |
| 22(1,B10) | X22 | 50 | plate1 |
| 23(1,B11) | X23 | 50 | plate1 |
| 24(1,B12) | X24 | 50 | plate1 |
| 25(1,C1) | X25 | 50 | plate1 |
| 26(1,C2) | X26 | 50 | plate1 |
| 27(1,C3) | X27 | 50 | plate1 |
| 28(1,C4) | X28 | 50 | plate1 |
| 29(1,C5) | X29 | 45 | plate1 |
| 30(1,C6) | X30 | 50 | plate1 |
| 31(1,C7) | X31 | 50 | plate1 |
| 32(1,C8) | X32 | 50 | plate1 |
| 33(1,C9) | X33 | 50 | plate1 |
| 34(1,C10) | X34 | 50 | plate1 |
| 35(1,C11) | X35 | 47 | plate1 |
| 36(1,C12) | X36 | 50 | plate1 |
| 37(1,D1) | X37 | 50 | plate1 |
| 38(1,D2) | X38 | 50 | plate1 |
| 39(1,D3) | X39 | 50 | plate1 |
| 40(1,D4) | X40 | 50 | plate1 |
| 41(1,D5) | X41 | 30 | plate1 |
| 42(1,D6) | X42 | 50 | plate1 |
| 43(1,D7) | X43 | 50 | plate1 |
| 44(1,D8) | X44 | 50 | plate1 |
| 45(1,D9) | X45 | 50 | plate1 |
| 46(1,D10) | X46 | 40 | plate1 |
| 47(1,D11) | X47 | 50 | plate1 |
| 48(1,D12) | X48 | 50 | plate1 |
| 49(1,E1) | X49 | 50 | plate1 |
| 50(1,E2) | X50 | 50 | plate1 |
| 51(1,E3) | X51 | 50 | plate1 |
| 52(1,E4) | X52 | 50 | plate1 |
| 53(1,E5) | X53 | 50 | plate1 |
| 54(1,E6) | X54 | 50 | plate1 |
| 55(1,E7) | X55 | 50 | plate1 |
| 56(1,E8) | X56 | 50 | plate1 |
| 57(1,E9) | X57 | 50 | plate1 |
| 58(1,E10) | X58 | 50 | plate1 |
| 59(1,E11) | X59 | 50 | plate1 |
| 60(1,E12) | X60 | 50 | plate1 |
| 61(1,F1) | X61 | 50 | plate1 |
| 62(1,F2) | X62 | 50 | plate1 |
| 63(1,F3) | X63 | 50 | plate1 |
| 64(1,F4) | X64 | 50 | plate1 |
| 65(1,F5) | X65 | 50 | plate1 |
| 66(1,F6) | X66 | 50 | plate1 |
| 67(1,F7) | X67 | 50 | plate1 |
| 68(1,F8) | X68 | 50 | plate1 |
| 69(1,F9) | X69 | 50 | plate1 |
| 70(1,F10) | X70 | 50 | plate1 |
| 71(1,F11) | X71 | 50 | plate1 |
| 72(1,F12) | X72 | 50 | plate1 |
| 73(1,G1) | X73 | 50 | plate1 |
| 74(1,G2) | X74 | 50 | plate1 |
| 75(1,G3) | X75 | 50 | plate1 |
| 76(1,G4) | X76 | 50 | plate1 |
| 77(1,G5) | X77 | 50 | plate1 |
| 78(1,G6) | X78 | 50 | plate1 |
| 79(1,G7) | X79 | 50 | plate1 |
| 80(1,G8) | X80 | 50 | plate1 |
| 81(1,G9) | X81 | 50 | plate1 |
| 82(1,G10) | X82 | 50 | plate1 |
| 83(1,G11) | X83 | 50 | plate1 |
| 84(1,G12) | X84 | 50 | plate1 |
| 85(1,H1) | X85 | 50 | plate1 |
| 86(1,H2) | X86 | 50 | plate1 |
| 87(1,H3) | X87 | 50 | plate1 |
| 88(1,H4) | X88 | 50 | plate1 |
| 89(1,H5) | X89 | 50 | plate1 |
| 90(1,H6) | X90 | 46 | plate1 |
| 91(1,H7) | X91 | 50 | plate1 |
| 92(1,H8) | X92 | 50 | plate1 |
| 93(1,H9) | X93 | 50 | plate1 |
| 94(1,H10) | X94 | 50 | plate1 |
| 95(1,H11) | X95 | 50 | plate1 |
| 96(1,H12) | X96 | 50 | plate1 |
$ blanks
| Location | Sample | PvLDH-ST | Plate |
|---|---|---|---|
| 1(1,A1) | Blank1 | 29 | plate1 |
| 2(1,A2) | Blank2 | 28 | plate1 |
$ stds
| Location | Sample | PvLDH-ST | Plate |
|---|---|---|---|
| 3(1,A3) | S1 | 23757.0 | plate1 |
| 4(1,A4) | S2 | 22604.5 | plate1 |
| 5(1,A5) | S3 | 12532.0 | plate1 |
| 6(1,A6) | S4 | 4441.5 | plate1 |
| 7(1,A7) | S5 | 1302.5 | plate1 |
| 8(1,A8) | S6 | 384.5 | plate1 |
| 9(1,A9) | S7 | 144.0 | plate1 |
| 10(1,A10) | S8 | 60.0 | plate1 |
| 11(1,A11) | S9 | 35.5 | plate1 |
| 12(1,A12) | S10 | 30.0 | plate1 |
$ run
| RunColumn | Plate |
|---|---|
| Acquisition Date: 01-Jan-2025, 11:11 AM | plate1 |
| Reader Serial Number: LX10014219408 | plate1 |
| RP1 PMT (Volts): 538.22 | plate1 |
| RP1 Target: 3698 | plate1 |
| Plate ID: | plate1 |
TipreadSeroData Output
This exports a list of data frames:
raw: The raw, unedited files: A check that the correct file/s were added.results: The processed serological data files: Antigen names compatible with the R package, clear columns for each antigen and their MFI results.counts: The bead counts detected from the Luminex instrument per antigen, per sample, for each plate.blanks: The MFI results for the blank wells.stds: The MFI results for the standard curve samples.run: The run information from the Luminex machine.
You can access each data frame, for example the results data frame, like this:
ldh_sero_data$results| Location | Sample | PvLDH-ST | Plate |
|---|---|---|---|
| 1(1,A1) | Blank1 | 29.0 | plate1 |
| 2(1,A2) | Blank2 | 28.0 | plate1 |
| 3(1,A3) | S1 | 23757.0 | plate1 |
| 4(1,A4) | S2 | 22604.5 | plate1 |
| 5(1,A5) | S3 | 12532.0 | plate1 |
| 6(1,A6) | S4 | 4441.5 | plate1 |
| 7(1,A7) | S5 | 1302.5 | plate1 |
| 8(1,A8) | S6 | 384.5 | plate1 |
| 9(1,A9) | S7 | 144.0 | plate1 |
| 10(1,A10) | S8 | 60.0 | plate1 |
| 11(1,A11) | S9 | 35.5 | plate1 |
| 12(1,A12) | S10 | 30.0 | plate1 |
| 13(1,B1) | X13 | 54.5 | plate1 |
| 14(1,B2) | X14 | 28.5 | plate1 |
| 15(1,B3) | X15 | 33.5 | plate1 |
| 16(1,B4) | X16 | 32.0 | plate1 |
| 17(1,B5) | X17 | 33.0 | plate1 |
| 18(1,B6) | X18 | 30.0 | plate1 |
| 19(1,B7) | X19 | 15646.5 | plate1 |
| 20(1,B8) | X20 | 40.0 | plate1 |
| 21(1,B9) | X21 | 46.5 | plate1 |
| 22(1,B10) | X22 | 32.0 | plate1 |
| 23(1,B11) | X23 | 33.5 | plate1 |
| 24(1,B12) | X24 | 114.0 | plate1 |
| 25(1,C1) | X25 | 29.0 | plate1 |
| 26(1,C2) | X26 | 48.5 | plate1 |
| 27(1,C3) | X27 | 41.0 | plate1 |
| 28(1,C4) | X28 | 52.0 | plate1 |
| 29(1,C5) | X29 | 29.0 | plate1 |
| 30(1,C6) | X30 | 28.5 | plate1 |
| 31(1,C7) | X31 | 38.0 | plate1 |
| 32(1,C8) | X32 | 27.5 | plate1 |
| 33(1,C9) | X33 | 40.0 | plate1 |
| 34(1,C10) | X34 | 23.0 | plate1 |
| 35(1,C11) | X35 | 32.0 | plate1 |
| 36(1,C12) | X36 | 26.0 | plate1 |
| 37(1,D1) | X37 | 32.5 | plate1 |
| 38(1,D2) | X38 | 34.0 | plate1 |
| 39(1,D3) | X39 | 25.5 | plate1 |
| 40(1,D4) | X40 | 35.0 | plate1 |
| 41(1,D5) | X41 | 73.5 | plate1 |
| 42(1,D6) | X42 | 22.0 | plate1 |
| 43(1,D7) | X43 | 28.5 | plate1 |
| 44(1,D8) | X44 | 35.5 | plate1 |
| 45(1,D9) | X45 | 24.0 | plate1 |
| 46(1,D10) | X46 | 98.0 | plate1 |
| 47(1,D11) | X47 | 26.0 | plate1 |
| 48(1,D12) | X48 | 33.0 | plate1 |
| 49(1,E1) | X49 | 25.5 | plate1 |
| 50(1,E2) | X50 | 32.0 | plate1 |
| 51(1,E3) | X51 | 81.5 | plate1 |
| 52(1,E4) | X52 | 29.5 | plate1 |
| 53(1,E5) | X53 | 25.0 | plate1 |
| 54(1,E6) | X54 | 42.0 | plate1 |
| 55(1,E7) | X55 | 46.5 | plate1 |
| 56(1,E8) | X56 | 29.0 | plate1 |
| 57(1,E9) | X57 | 24.0 | plate1 |
| 58(1,E10) | X58 | 37.0 | plate1 |
| 59(1,E11) | X59 | 37.5 | plate1 |
| 60(1,E12) | X60 | 32.5 | plate1 |
| 61(1,F1) | X61 | 25.5 | plate1 |
| 62(1,F2) | X62 | 33.5 | plate1 |
| 63(1,F3) | X63 | 31.0 | plate1 |
| 64(1,F4) | X64 | 36.5 | plate1 |
| 65(1,F5) | X65 | 22.0 | plate1 |
| 66(1,F6) | X66 | 39.0 | plate1 |
| 67(1,F7) | X67 | 37.5 | plate1 |
| 68(1,F8) | X68 | 36.0 | plate1 |
| 69(1,F9) | X69 | 22.0 | plate1 |
| 70(1,F10) | X70 | 30.0 | plate1 |
| 71(1,F11) | X71 | 32.0 | plate1 |
| 72(1,F12) | X72 | 26.0 | plate1 |
| 73(1,G1) | X73 | 25.5 | plate1 |
| 74(1,G2) | X74 | 28.5 | plate1 |
| 75(1,G3) | X75 | 31.0 | plate1 |
| 76(1,G4) | X76 | 30.0 | plate1 |
| 77(1,G5) | X77 | 27.0 | plate1 |
| 78(1,G6) | X78 | 33.0 | plate1 |
| 79(1,G7) | X79 | 27.5 | plate1 |
| 80(1,G8) | X80 | 36.0 | plate1 |
| 81(1,G9) | X81 | 22.0 | plate1 |
| 82(1,G10) | X82 | 30.0 | plate1 |
| 83(1,G11) | X83 | 24.5 | plate1 |
| 84(1,G12) | X84 | 31.0 | plate1 |
| 85(1,H1) | X85 | 26.5 | plate1 |
| 86(1,H2) | X86 | 32.0 | plate1 |
| 87(1,H3) | X87 | 26.0 | plate1 |
| 88(1,H4) | X88 | 35.0 | plate1 |
| 89(1,H5) | X89 | 24.0 | plate1 |
| 90(1,H6) | X90 | 64.0 | plate1 |
| 91(1,H7) | X91 | 33.5 | plate1 |
| 92(1,H8) | X92 | 31.5 | plate1 |
| 93(1,H9) | X93 | 27.0 | plate1 |
| 94(1,H10) | X94 | 24.0 | plate1 |
| 95(1,H11) | X95 | 34.5 | plate1 |
| 96(1,H12) | X96 | 27.5 | plate1 |
Next, you need to read in the plate layout! This file will allow us to relabel the raw luminex data from “unknowns” to our study Sample ID’s.
ldh_plate_list <- readPlateLayout(
  plate_layout = your_LDH_plate_layout,
  sero_data  = ldh_sero_data
)
#> Plate layouts correctly identified!ldh_plate_list$ plate1
| Plate | 1 | 2 | 3 | 4 | 5 | 6 | 7 | 8 | 9 | 10 | 11 | 12 |
|---|---|---|---|---|---|---|---|---|---|---|---|---|
| A | Blank1 | Blank2 | S1 | S2 | S3 | S4 | S5 | S6 | S7 | S8 | S9 | S10 |
| B | ABC013 | ABC014 | ABC015 | ABC016 | ABC017 | ABC018 | ABC019 | ABC020 | ABC021 | ABC022 | ABC023 | ABC024 |
| C | ABC025 | ABC026 | ABC027 | ABC028 | ABC029 | ABC030 | ABC031 | ABC032 | ABC033 | ABC034 | ABC035 | ABC036 |
| D | ABC037 | ABC038 | ABC039 | ABC040 | ABC041 | ABC042 | ABC043 | ABC044 | ABC045 | ABC046 | ABC047 | ABC048 |
| E | ABC049 | ABC050 | ABC051 | ABC052 | ABC053 | ABC054 | ABC055 | ABC056 | ABC057 | ABC058 | ABC059 | ABC060 |
| F | ABC061 | ABC062 | ABC063 | ABC064 | ABC065 | ABC066 | ABC067 | ABC068 | ABC069 | ABC070 | ABC071 | ABC072 |
| G | ABC073 | ABC074 | ABC075 | ABC076 | ABC077 | ABC078 | ABC079 | ABC080 | ABC081 | ABC082 | ABC083 | ABC084 |
| H | ABC085 | ABC086 | ABC087 | ABC088 | ABC089 | ABC090 | ABC091 | ABC092 | ABC093 | ABC094 | ABC095 | ABC096 |
$ plate2
| Plate | 1 | 2 | 3 | 4 | 5 | 6 | 7 | 8 | 9 | 10 | 11 | 12 |
|---|---|---|---|---|---|---|---|---|---|---|---|---|
| A | Blank1 | Blank2 | S1 | S2 | S3 | S4 | S5 | S6 | S7 | S8 | S9 | S10 |
| B | ABC097 | ABC098 | ABC099 | ABC100 | ABC101 | ABC102 | ABC103 | ABC104 | ABC105 | ABC106 | ABC107 | ABC108 |
| C | ABC109 | ABC110 | ABC111 | ABC112 | ABC113 | ABC114 | ABC115 | ABC116 | ABC117 | ABC118 | ABC119 | ABC120 |
| D | ABC121 | ABC122 | ABC123 | ABC124 | ABC125 | ABC126 | ABC127 | ABC128 | ABC129 | ABC130 | ABC131 | ABC132 |
| E | ABC133 | ABC134 | ABC135 | ABC136 | ABC137 | ABC138 | ABC139 | ABC140 | ABC141 | ABC142 | ABC143 | ABC144 |
| F | ABC145 | ABC146 | ABC147 | ABC148 | ABC149 | ABC150 | ABC151 | ABC152 | ABC153 | ABC154 | ABC155 | ABC156 |
| G | ABC157 | ABC158 | ABC159 | ABC160 | ABC161 | ABC162 | ABC163 | ABC164 | ABC165 | ABC166 | ABC167 | ABC168 |
| H | ABC169 | ABC170 | ABC171 | ABC172 | ABC173 | ABC174 | ABC175 | ABC176 | ABC177 | ABC178 | ABC179 | ABC180 |
$ plate3
| Plate | 1 | 2 | 3 | 4 | 5 | 6 | 7 | 8 | 9 | 10 | 11 | 12 |
|---|---|---|---|---|---|---|---|---|---|---|---|---|
| A | Blank1 | Blank2 | S1 | S2 | S3 | S4 | S5 | S6 | S7 | S8 | S9 | S10 |
| B | ABC181 | ABC182 | ABC183 | ABC184 | ABC185 | ABC186 | ABC187 | ABC188 | ABC189 | ABC190 | ABC191 | ABC192 |
| C | ABC193 | ABC194 | ABC195 | ABC196 | ABC197 | ABC198 | ABC199 | ABC200 | ABC201 | ABC202 | ABC203 | ABC204 |
| D | ABC205 | ABC206 | ABC207 | ABC208 | ABC209 | ABC210 | ABC211 | ABC212 | ABC213 | ABC214 | ABC215 | ABC216 |
| E | ABC217 | ABC218 | ABC219 | ABC220 | ABC221 | ABC222 | ABC223 | ABC224 | ABC225 | ABC226 | ABC227 | ABC228 |
| F | ABC229 | ABC230 | ABC231 | ABC232 | ABC233 | ABC234 | ABC235 | ABC236 | ABC237 | ABC238 | ABC239 | ABC240 |
| G | ABC241 | ABC242 | ABC243 | ABC244 | ABC245 | ABC246 | ABC247 | ABC248 | ABC249 | ABC250 | ABC251 | ABC252 |
| H | ABC253 | ABC254 | ABC255 | ABC256 | ABC257 | ABC258 | ABC259 | ABC260 | ABC261 | ABC262 | ABC263 | ABC264 |
Great! Now our serological data has been processed and our plate layouts are added into R-compatible data frames ready for analysis!
3.3 Step 2: Quality control checks
Quality control checks can also be run on any serological data file that has been processed using the readSeroData() and readPlateLayout() functions. The runQC() function will:
- Process bead count data (assigns a warning if bead counts are less than 15 or above 500 per antigen).
- Assign Sample ID’s to Luminex outputs.
ldh_qc_results  <- runQC(
  sero_data = ldh_sero_data,       # load in your serological data variable
  plate_list = ldh_plate_list      # load your plate list variable
)
TiprunQC Output
This exports a list of data frames:
- `processCounts_output``: The bead counts per antigen, per sample, for each plate. Intermediary file for downstream processing. Warning = 0 for pass and = 1 for fail.
getCounts_output: The processed bead counts file for each sample, summarising whether a sample needs to be repeated. Intermediary file for downstream processing.sampleid_output: Aligning the Luminex anonymised data (SampleID) to the plate layout ID’s (Sample). Intermediary file for downstream processing.getAntigenCounts_output: The processed bead counts file per antigen per sample. Used forplotBeadCounts().getCountsQC_output: The bead counts and QC results per antigen. Key file.
You can access each data frame, for example the getCountsQC_output data frame, like this:
ldh_qc_results$getCountsQC_output| Location | SampleID | Plate | PvLDH-ST_Count | PvLDH-ST_QC | QC_total |
|---|---|---|---|---|---|
| A1 | Blank1 | plate1 | 50 | pass | pass |
| A10 | S8 | plate1 | 50 | pass | pass |
| A11 | S9 | plate1 | 50 | pass | pass |
| A12 | S10 | plate1 | 50 | pass | pass |
| A2 | Blank2 | plate1 | 50 | pass | pass |
| A3 | S1 | plate1 | 50 | pass | pass |
| A4 | S2 | plate1 | 50 | pass | pass |
| A5 | S3 | plate1 | 50 | pass | pass |
| A6 | S4 | plate1 | 50 | pass | pass |
| A7 | S5 | plate1 | 50 | pass | pass |
| A8 | S6 | plate1 | 50 | pass | pass |
| A9 | S7 | plate1 | 50 | pass | pass |
| B1 | ABC013 | plate1 | 50 | pass | pass |
| B10 | ABC022 | plate1 | 50 | pass | pass |
| B11 | ABC023 | plate1 | 50 | pass | pass |
| B12 | ABC024 | plate1 | 50 | pass | pass |
| B2 | ABC014 | plate1 | 50 | pass | pass |
| B3 | ABC015 | plate1 | 50 | pass | pass |
| B4 | ABC016 | plate1 | 50 | pass | pass |
| B5 | ABC017 | plate1 | 50 | pass | pass |
| B6 | ABC018 | plate1 | 50 | pass | pass |
| B7 | ABC019 | plate1 | 50 | pass | pass |
| B8 | ABC020 | plate1 | 50 | pass | pass |
| B9 | ABC021 | plate1 | 50 | pass | pass |
| C1 | ABC025 | plate1 | 50 | pass | pass |
| C10 | ABC034 | plate1 | 50 | pass | pass |
| C11 | ABC035 | plate1 | 47 | pass | pass |
| C12 | ABC036 | plate1 | 50 | pass | pass |
| C2 | ABC026 | plate1 | 50 | pass | pass |
| C3 | ABC027 | plate1 | 50 | pass | pass |
| C4 | ABC028 | plate1 | 50 | pass | pass |
| C5 | ABC029 | plate1 | 45 | pass | pass |
| C6 | ABC030 | plate1 | 50 | pass | pass |
| C7 | ABC031 | plate1 | 50 | pass | pass |
| C8 | ABC032 | plate1 | 50 | pass | pass |
| C9 | ABC033 | plate1 | 50 | pass | pass |
| D1 | ABC037 | plate1 | 50 | pass | pass |
| D10 | ABC046 | plate1 | 40 | pass | pass |
| D11 | ABC047 | plate1 | 50 | pass | pass |
| D12 | ABC048 | plate1 | 50 | pass | pass |
| D2 | ABC038 | plate1 | 50 | pass | pass |
| D3 | ABC039 | plate1 | 50 | pass | pass |
| D4 | ABC040 | plate1 | 50 | pass | pass |
| D5 | ABC041 | plate1 | 30 | pass | pass |
| D6 | ABC042 | plate1 | 50 | pass | pass |
| D7 | ABC043 | plate1 | 50 | pass | pass |
| D8 | ABC044 | plate1 | 50 | pass | pass |
| D9 | ABC045 | plate1 | 50 | pass | pass |
| E1 | ABC049 | plate1 | 50 | pass | pass |
| E10 | ABC058 | plate1 | 50 | pass | pass |
| E11 | ABC059 | plate1 | 50 | pass | pass |
| E12 | ABC060 | plate1 | 50 | pass | pass |
| E2 | ABC050 | plate1 | 50 | pass | pass |
| E3 | ABC051 | plate1 | 50 | pass | pass |
| E4 | ABC052 | plate1 | 50 | pass | pass |
| E5 | ABC053 | plate1 | 50 | pass | pass |
| E6 | ABC054 | plate1 | 50 | pass | pass |
| E7 | ABC055 | plate1 | 50 | pass | pass |
| E8 | ABC056 | plate1 | 50 | pass | pass |
| E9 | ABC057 | plate1 | 50 | pass | pass |
| F1 | ABC061 | plate1 | 50 | pass | pass |
| F10 | ABC070 | plate1 | 50 | pass | pass |
| F11 | ABC071 | plate1 | 50 | pass | pass |
| F12 | ABC072 | plate1 | 50 | pass | pass |
| F2 | ABC062 | plate1 | 50 | pass | pass |
| F3 | ABC063 | plate1 | 50 | pass | pass |
| F4 | ABC064 | plate1 | 50 | pass | pass |
| F5 | ABC065 | plate1 | 50 | pass | pass |
| F6 | ABC066 | plate1 | 50 | pass | pass |
| F7 | ABC067 | plate1 | 50 | pass | pass |
| F8 | ABC068 | plate1 | 50 | pass | pass |
| F9 | ABC069 | plate1 | 50 | pass | pass |
| G1 | ABC073 | plate1 | 50 | pass | pass |
| G10 | ABC082 | plate1 | 50 | pass | pass |
| G11 | ABC083 | plate1 | 50 | pass | pass |
| G12 | ABC084 | plate1 | 50 | pass | pass |
| G2 | ABC074 | plate1 | 50 | pass | pass |
| G3 | ABC075 | plate1 | 50 | pass | pass |
| G4 | ABC076 | plate1 | 50 | pass | pass |
| G5 | ABC077 | plate1 | 50 | pass | pass |
| G6 | ABC078 | plate1 | 50 | pass | pass |
| G7 | ABC079 | plate1 | 50 | pass | pass |
| G8 | ABC080 | plate1 | 50 | pass | pass |
| G9 | ABC081 | plate1 | 50 | pass | pass |
| H1 | ABC085 | plate1 | 50 | pass | pass |
| H10 | ABC094 | plate1 | 50 | pass | pass |
| H11 | ABC095 | plate1 | 50 | pass | pass |
| H12 | ABC096 | plate1 | 50 | pass | pass |
| H2 | ABC086 | plate1 | 50 | pass | pass |
| H3 | ABC087 | plate1 | 50 | pass | pass |
| H4 | ABC088 | plate1 | 50 | pass | pass |
| H5 | ABC089 | plate1 | 50 | pass | pass |
| H6 | ABC090 | plate1 | 46 | pass | pass |
| H7 | ABC091 | plate1 | 50 | pass | pass |
| H8 | ABC092 | plate1 | 50 | pass | pass |
| H9 | ABC093 | plate1 | 50 | pass | pass |
You can also visualise QC results using the ldh_sero_data and ldh_qc_results variables.
3.3.1 Standard Curve Plot
The plotStds_all() function plots the standard curve, generated from the antibody data from the standards you indicated in your plate layout (e.g. S1-S10) and Median Fluorescent Intensity (MFI) units are displayed in log10-adjusted scale.
In the case of the PvSeroTAT multi-antigen panel, the antigens will be displayed and in general your standard curves should look relatively linear (only when the y-axis is on log-adjusted scale).
plotStds_all(ldh_sero_data, experiment_name = "experiment1")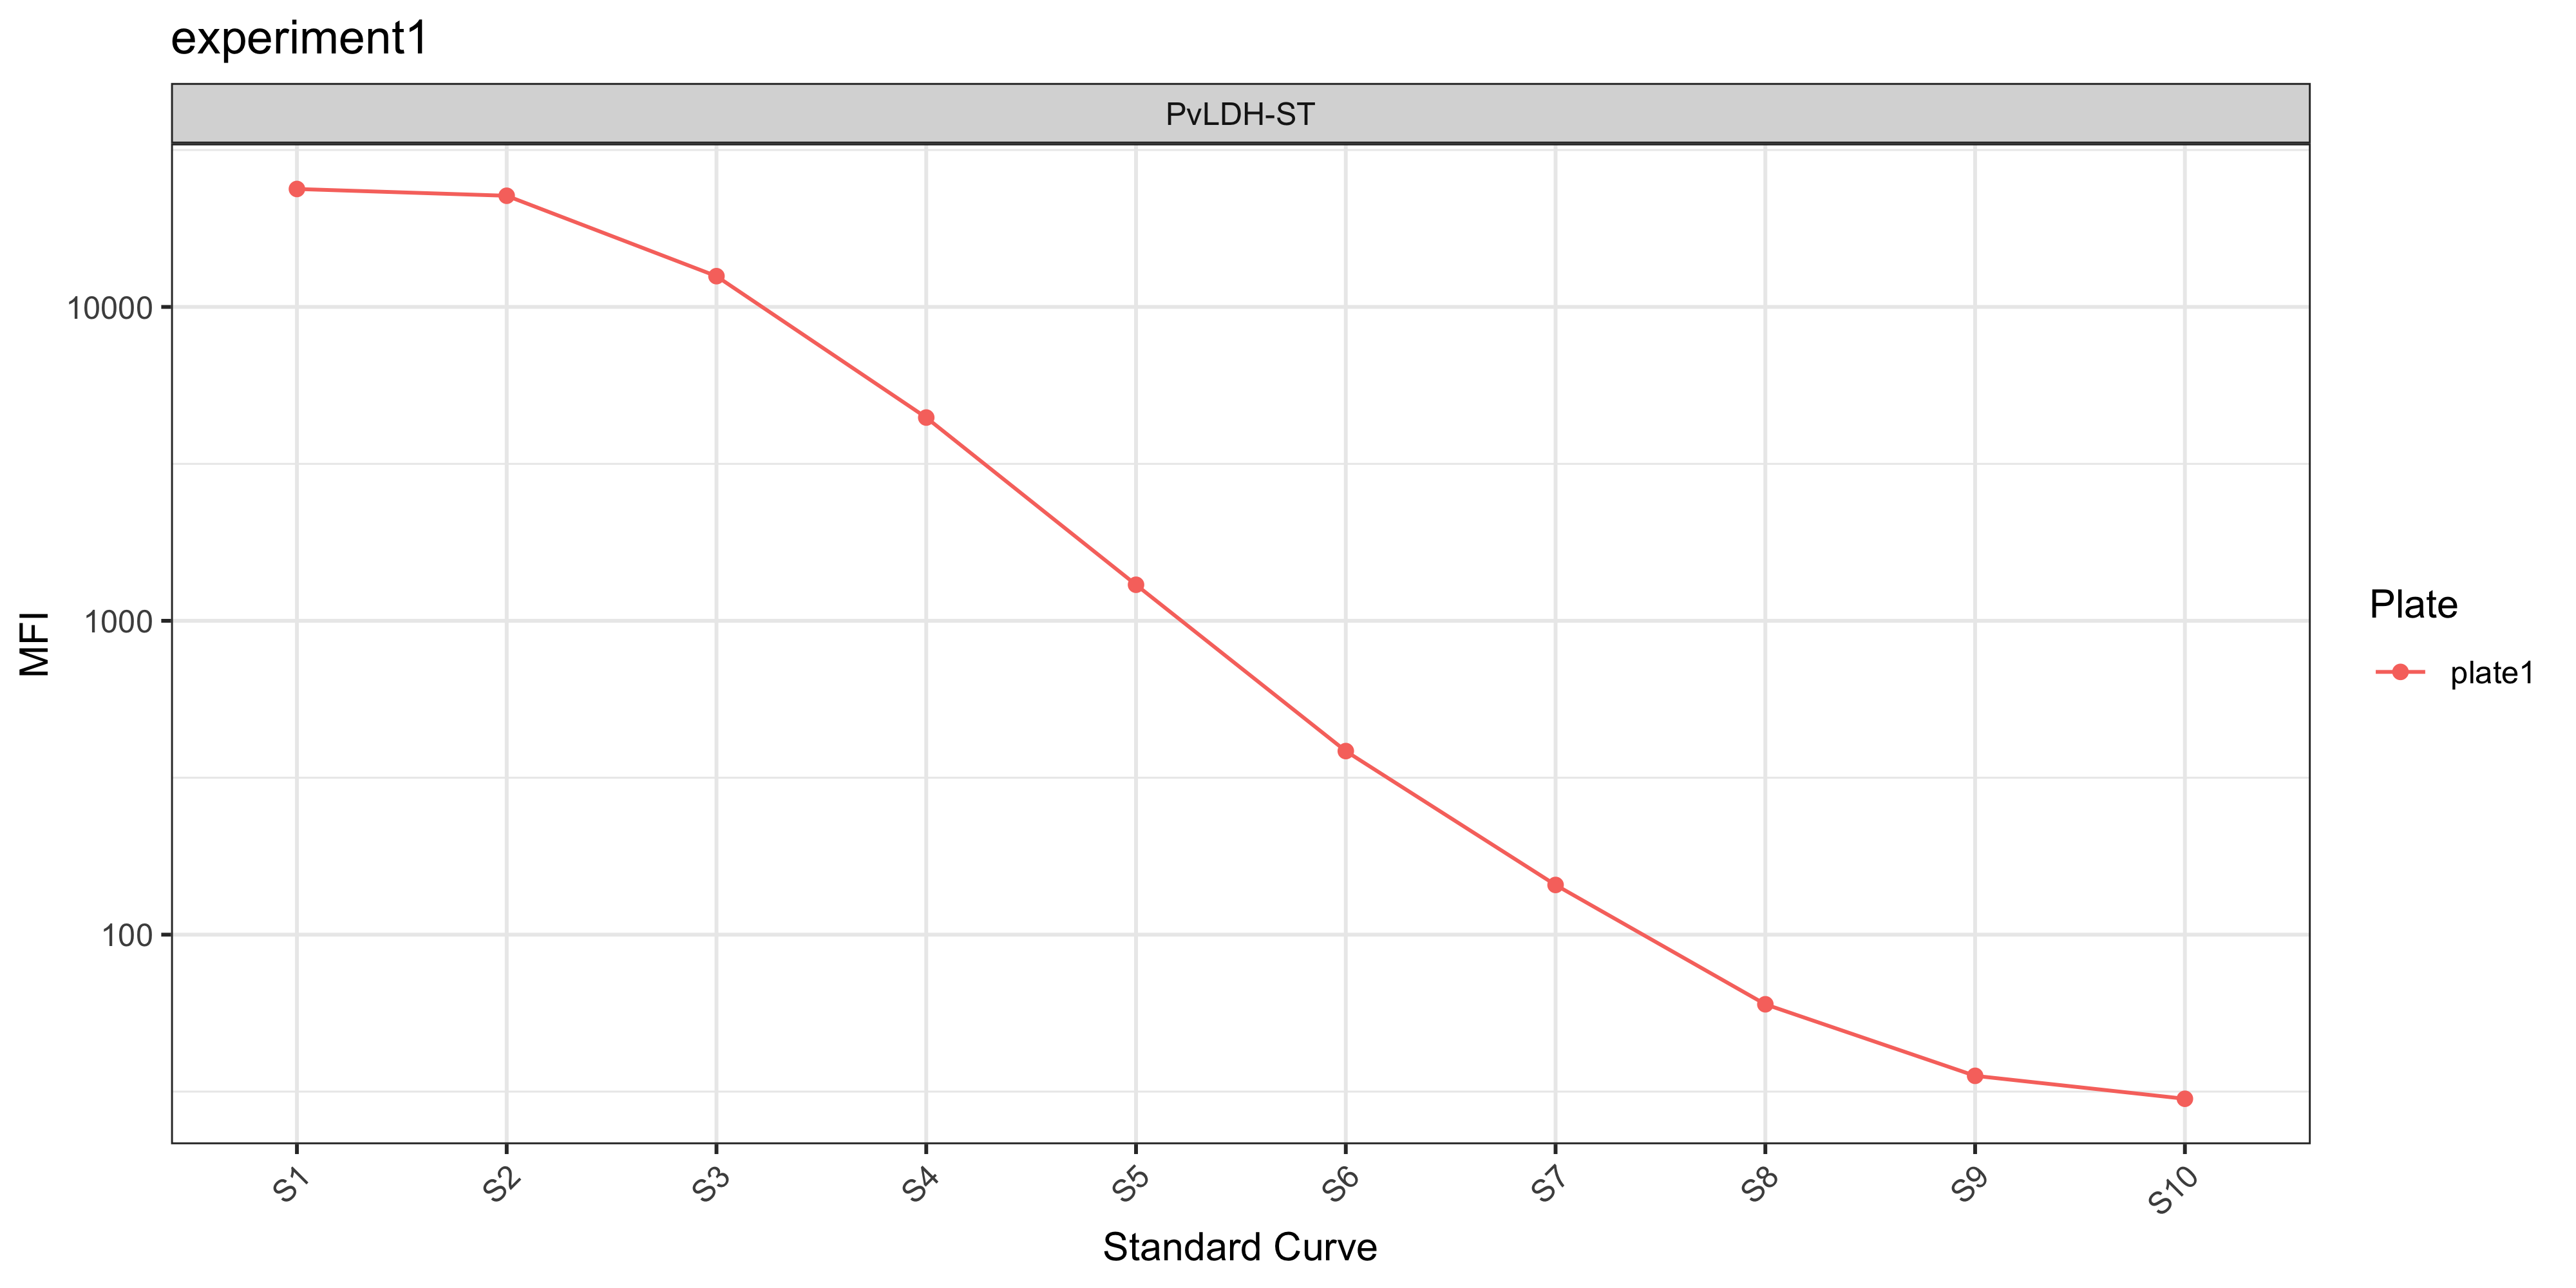
For more information on how to interrogate and visualise standard curves, see the Explore Standard Curves page.
3.3.2 Bead Counts QC Plot
The plotCounts() function provides a summary of the bead counts for each plate well are displayed, with blue indicating there are sufficient beads (≥15) or red when there are not enough. If any of the wells are red, they should be double-checked manually and re-run on a new plate if required.
plotCounts(ldh_qc_results, experiment_name = "experiment1")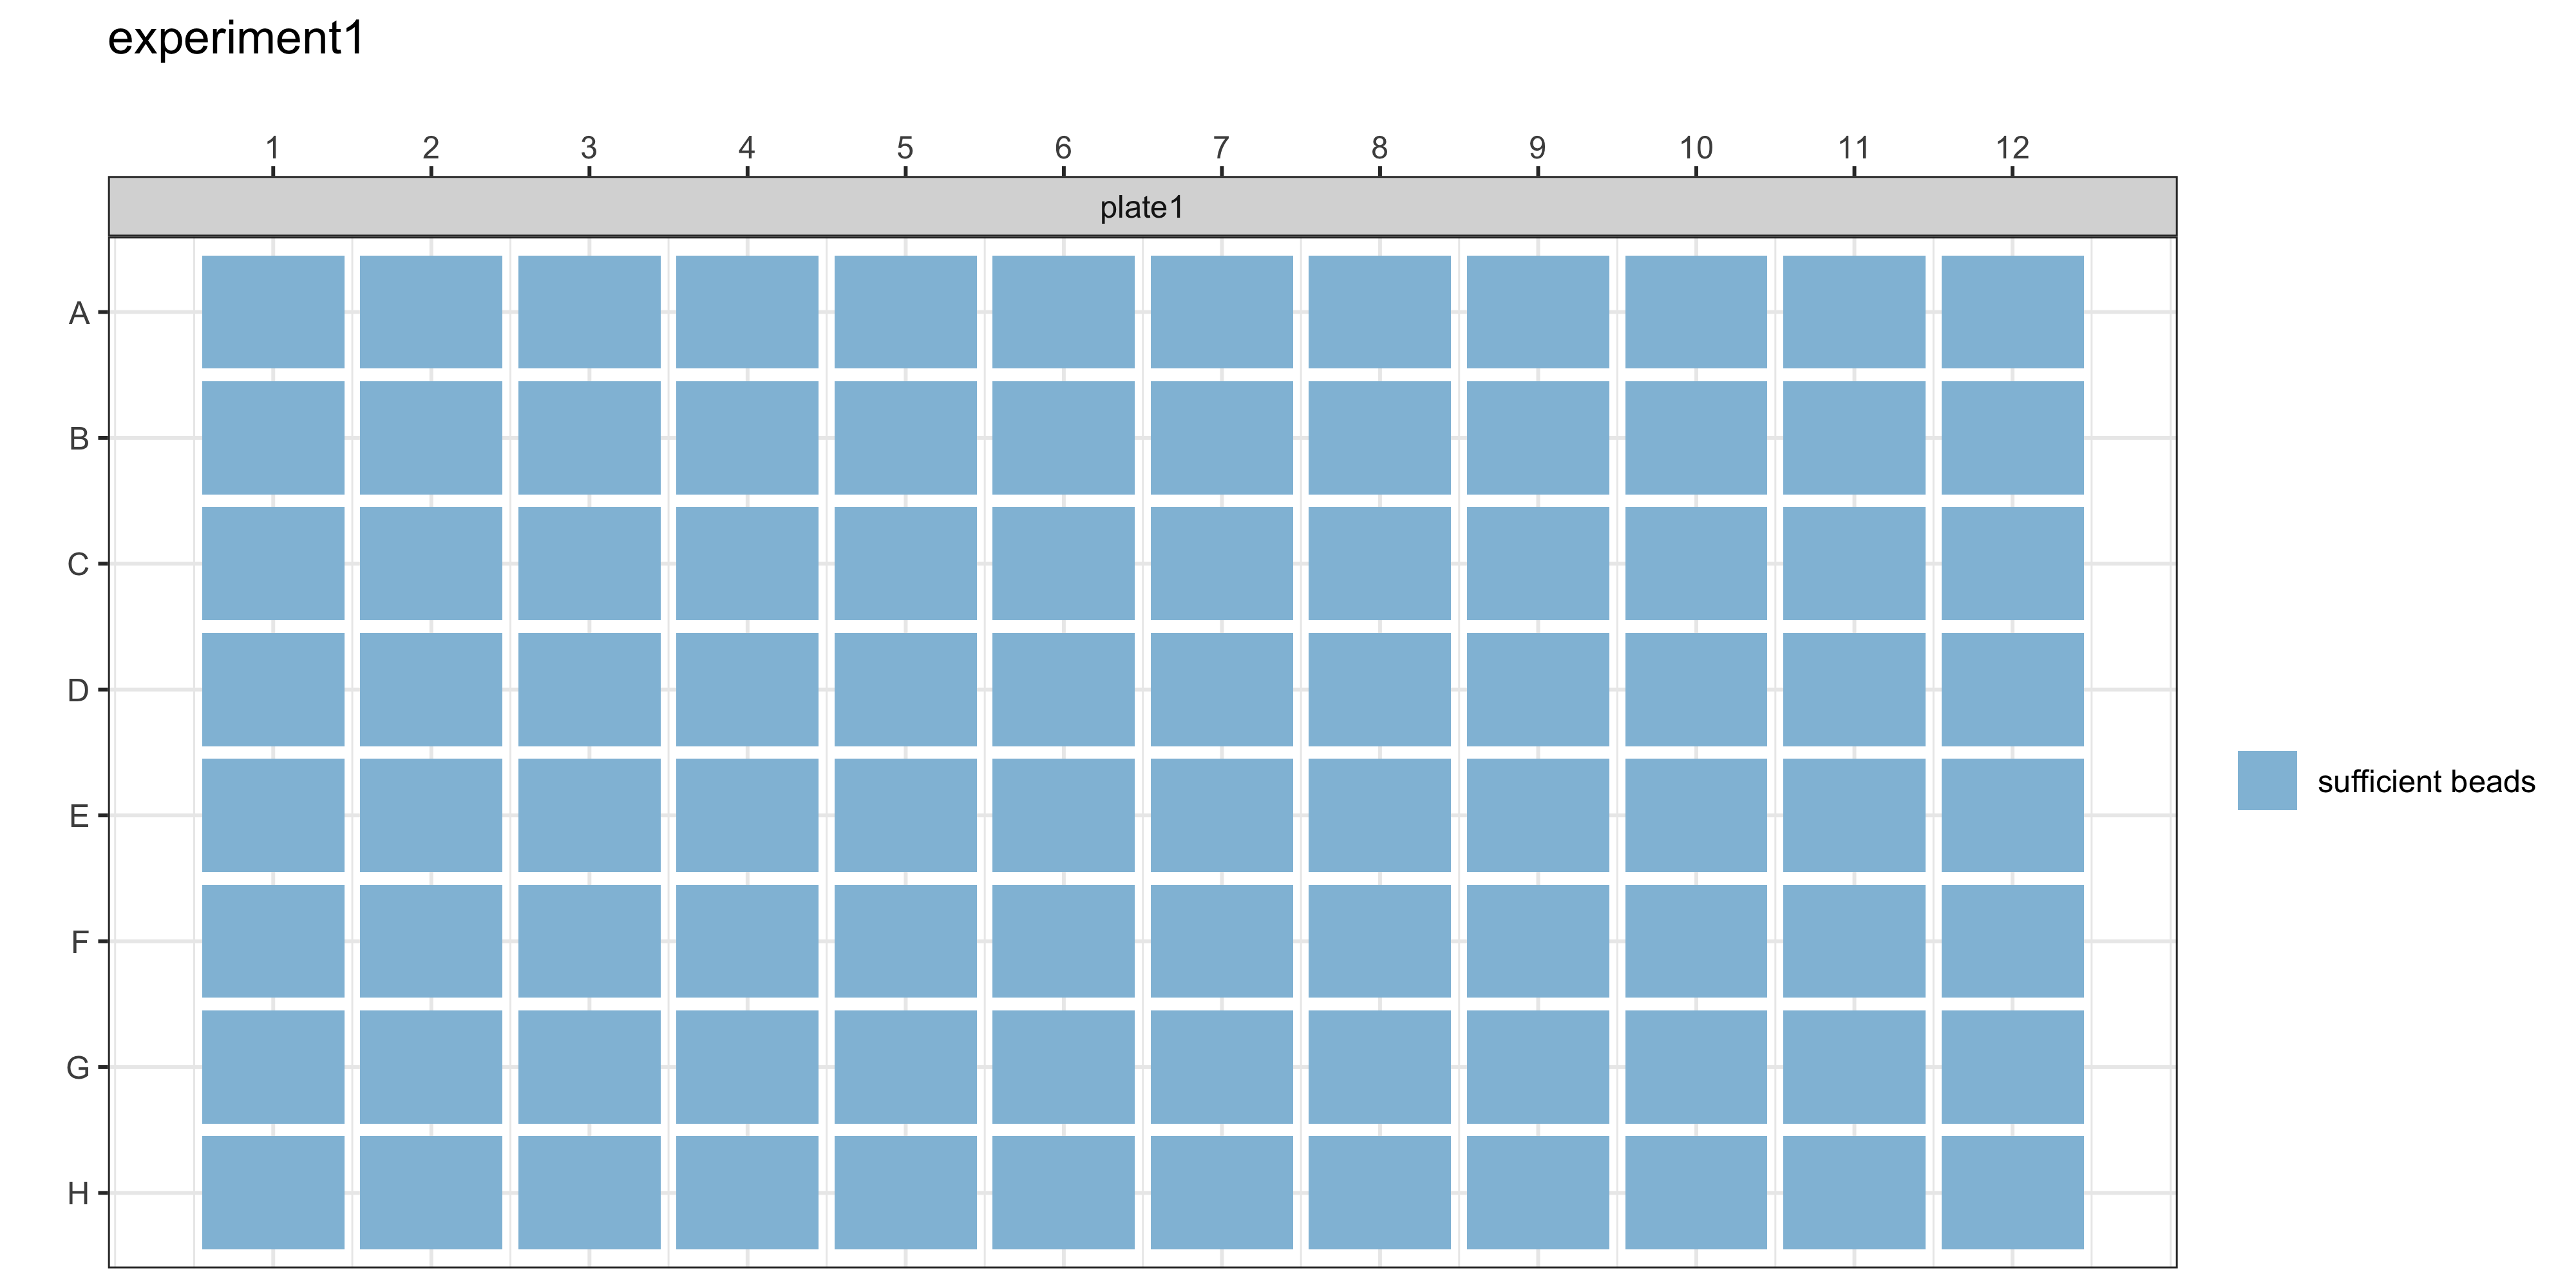
getRepeats(ldh_qc_results, ldh_plate_list)The getRepeats() function will inform you whether there are “No repeats necessary” or provide a list of samples to be re-run. In the example data, the beads in plate 2 wells A1 and A2 will need to be repeated.
| x |
|---|
| No repeats necessary. |
For more information on how to visualise these data, see the Bead Counts page.
3.3.3 Blanks QC Plot
The Median Fluorescent Intensity (MFI) units for each antigen is displayed for your blank samples. In general, each blank sample should have ≤50 MFI for each antigen, if they are higher they should be cross-checked manually.
plotBlanks(ldh_sero_data, experiment_name = "experiment1")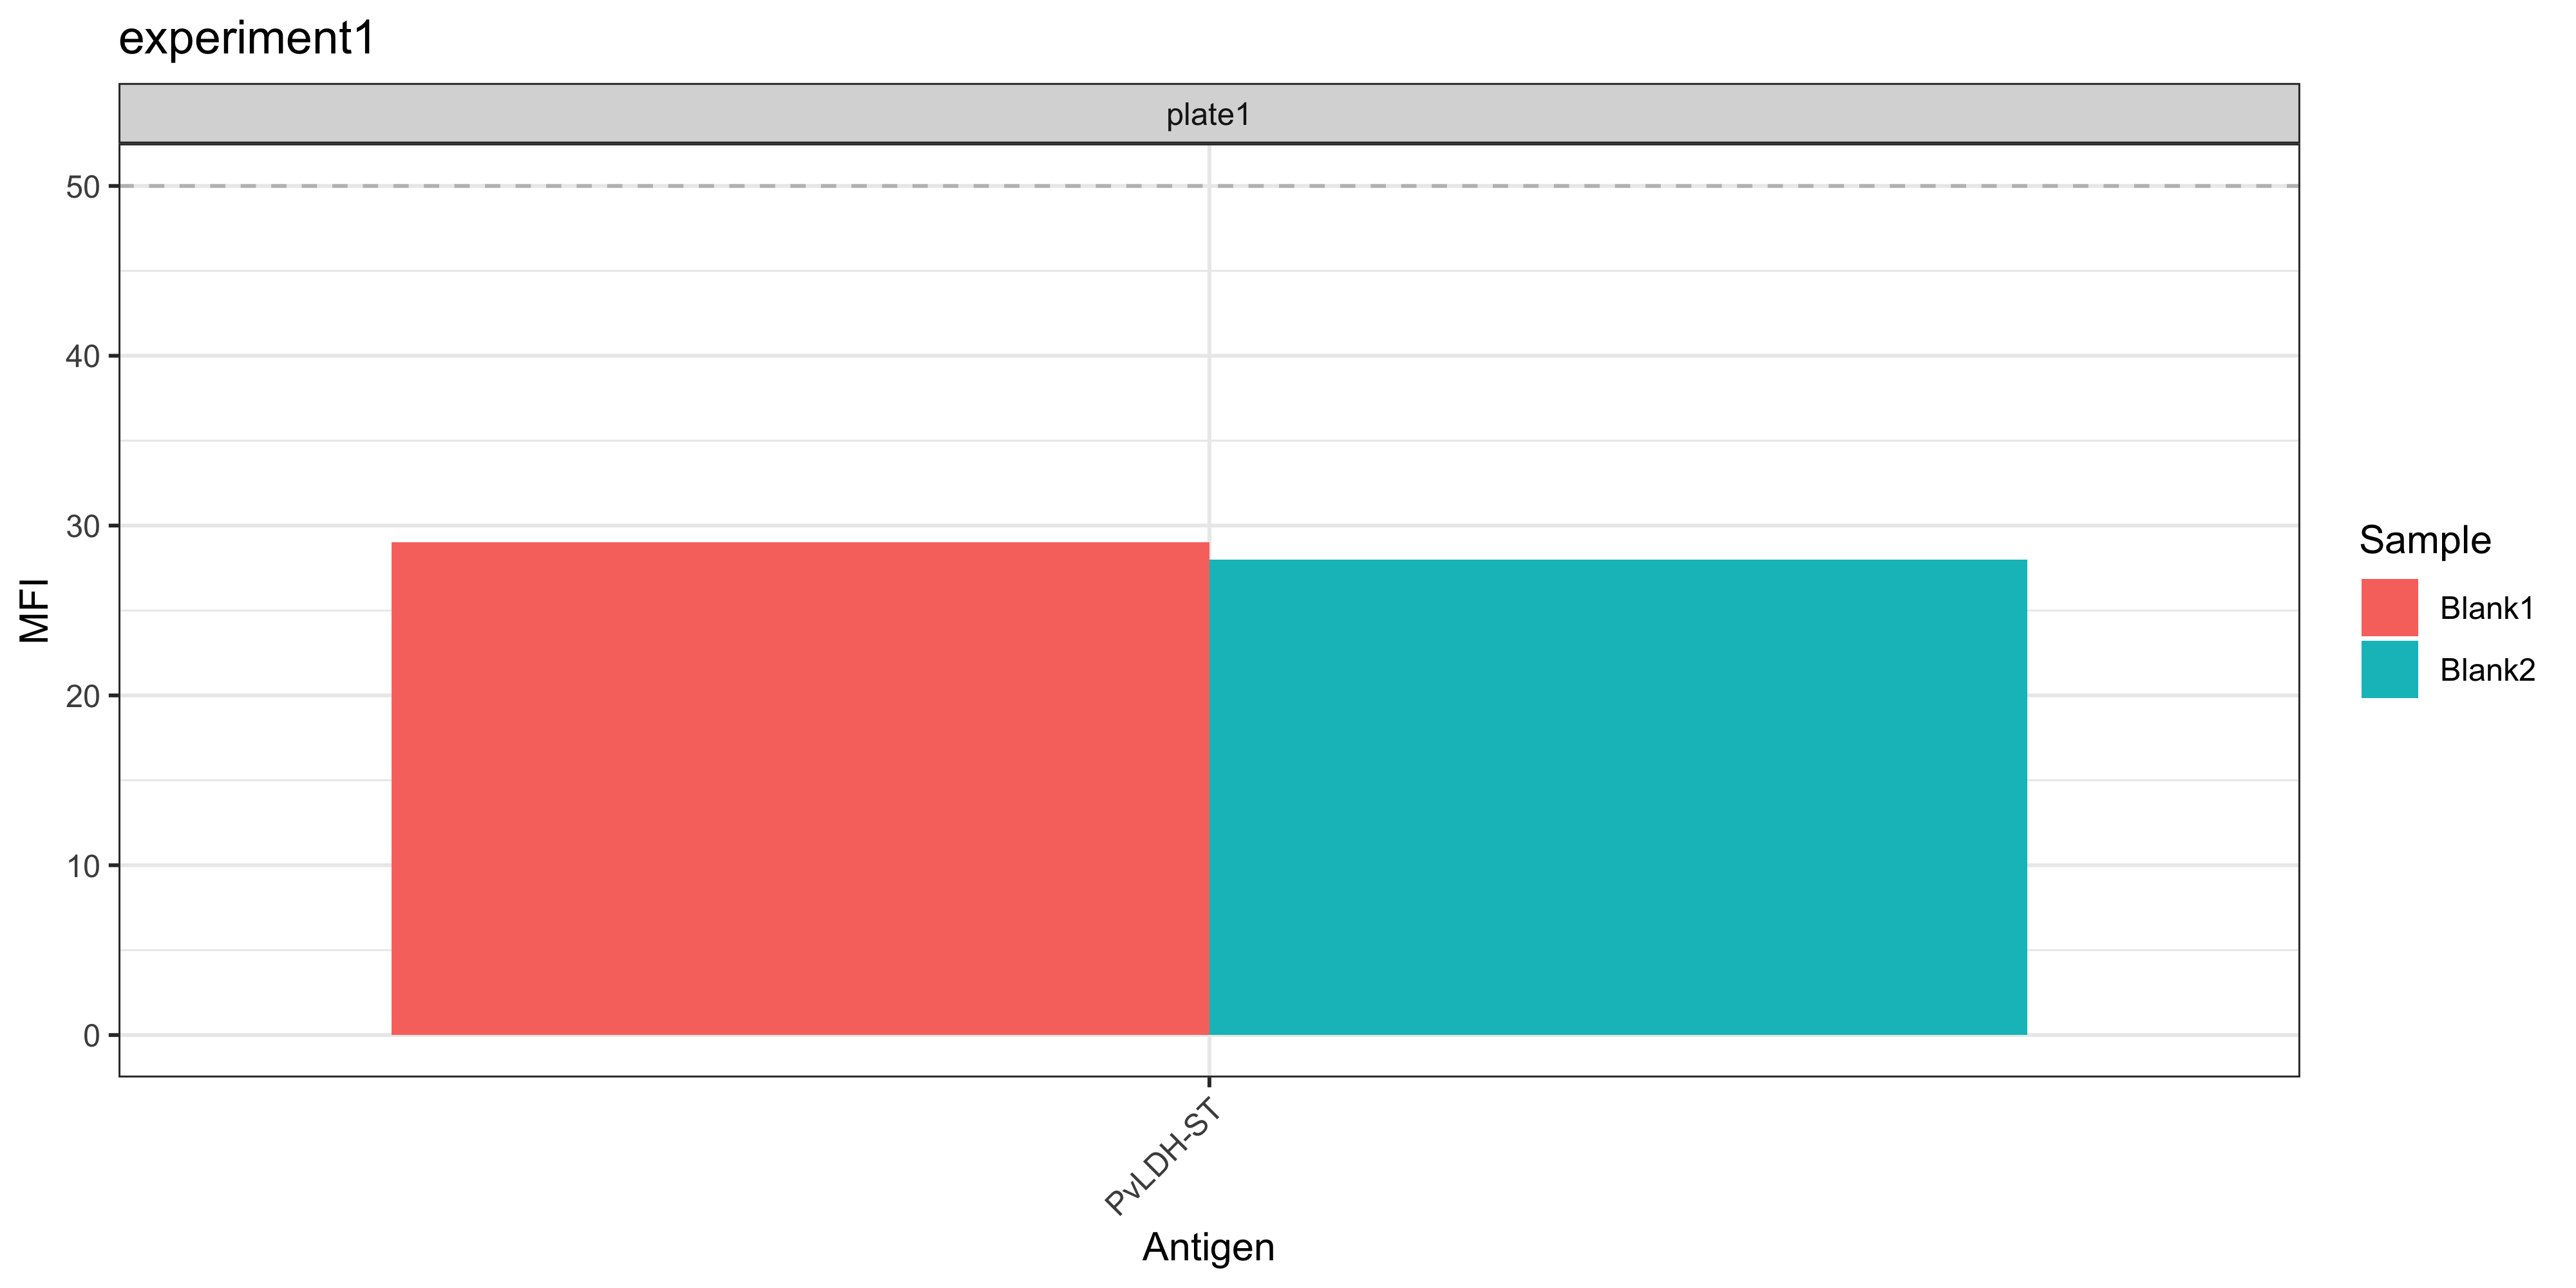
In the example data, blank samples recorded higher MFI values for LF005 on plate 1 and should be checked to confirm this is expected from the assay.
3.4 Step 3: MFI to RAU conversion
The automated data processing allows you to convert your Median Fluorescent Intensity (MFI) data into Relative Antibody Units (RAU) by fitting a 5-parameter logistic function to the standard curve on a per-antigen level using the MFItoRAU_LDH() function.
Key input variables:
sero_data,plate_list: Previously defined variables from thereadSeroData()andreadPlateLayout()functions.dilution: 10-point standard curve dilution: The default is: 1000000, 333333.33, 111111.11, 37037.04, 12345.68, 4115.23, 1371.74, 457.25, 152.42, 50.81 and does not need to be specified again unless changing.
ldh_mfi_to_rau_output <- MFItoRAU_LDH(
  sero_data = ldh_sero_data,
  plate_list = ldh_plate_list,
  file_path = NULL                      # Defaults to current folder/working directory
)
The mfi_to_rau_output variable contains the processed MFI and RAU data for each antigen per sample.
ldh_mfi_to_rau_output| SampleID | Location.2 | Location | Sample | Plate | PvLDH-ST_MFI | PvLDH-ST_Dilution | PvLDH-ST_DilutionReciprocal | PvLDH-ST_MinStd | PvLDH-ST_MaxDilution | PvLDH-ST_MaxStd | PvLDH-ST_MinDilution |
|---|---|---|---|---|---|---|---|---|---|---|---|
| ABC013 | B1 | 13(1,B1) | X13 | plate1 | 54.5 | 331.39839 | 0.0030175 | 30 | 50.81 | 23757 | 1e+06 |
| ABC014 | B2 | 14(1,B2) | X14 | plate1 | 28.5 | 57.58667 | 0.0173651 | 30 | 50.81 | 23757 | 1e+06 |
| ABC015 | B3 | 15(1,B3) | X15 | plate1 | 33.5 | 99.51295 | 0.0100489 | 30 | 50.81 | 23757 | 1e+06 |
| ABC016 | B4 | 16(1,B4) | X16 | plate1 | 32.0 | 86.11941 | 0.0116118 | 30 | 50.81 | 23757 | 1e+06 |
| ABC017 | B5 | 17(1,B5) | X17 | plate1 | 33.0 | 94.97809 | 0.0105287 | 30 | 50.81 | 23757 | 1e+06 |
| ABC018 | B6 | 18(1,B6) | X18 | plate1 | 30.0 | 69.31294 | 0.0144273 | 30 | 50.81 | 23757 | 1e+06 |
| ABC019 | B7 | 19(1,B7) | X19 | plate1 | 15646.5 | 168453.19936 | 0.0000059 | 30 | 50.81 | 23757 | 1e+06 |
| ABC020 | B8 | 20(1,B8) | X20 | plate1 | 40.0 | 163.88850 | 0.0061017 | 30 | 50.81 | 23757 | 1e+06 |
| ABC021 | B9 | 21(1,B9) | X21 | plate1 | 46.5 | 235.91408 | 0.0042388 | 30 | 50.81 | 23757 | 1e+06 |
| ABC022 | B10 | 22(1,B10) | X22 | plate1 | 32.0 | 86.11941 | 0.0116118 | 30 | 50.81 | 23757 | 1e+06 |
| ABC023 | B11 | 23(1,B11) | X23 | plate1 | 33.5 | 99.51295 | 0.0100489 | 30 | 50.81 | 23757 | 1e+06 |
| ABC024 | B12 | 24(1,B12) | X24 | plate1 | 114.0 | 1110.00315 | 0.0009009 | 30 | 50.81 | 23757 | 1e+06 |
| ABC025 | C1 | 25(1,C1) | X25 | plate1 | 29.0 | 61.40623 | 0.0162850 | 30 | 50.81 | 23757 | 1e+06 |
| ABC026 | C2 | 26(1,C2) | X26 | plate1 | 48.5 | 259.19654 | 0.0038581 | 30 | 50.81 | 23757 | 1e+06 |
| ABC027 | C3 | 27(1,C3) | X27 | plate1 | 41.0 | 174.54758 | 0.0057291 | 30 | 50.81 | 23757 | 1e+06 |
| ABC028 | C4 | 28(1,C4) | X28 | plate1 | 52.0 | 300.93123 | 0.0033230 | 30 | 50.81 | 23757 | 1e+06 |
| ABC029 | C5 | 29(1,C5) | X29 | plate1 | 29.0 | 61.40623 | 0.0162850 | 30 | 50.81 | 23757 | 1e+06 |
| ABC030 | C6 | 30(1,C6) | X30 | plate1 | 28.5 | 57.58667 | 0.0173651 | 30 | 50.81 | 23757 | 1e+06 |
| ABC031 | C7 | 31(1,C7) | X31 | plate1 | 38.0 | 143.11729 | 0.0069873 | 30 | 50.81 | 23757 | 1e+06 |
| ABC032 | C8 | 32(1,C8) | X32 | plate1 | 27.5 | 50.22995 | 0.0199084 | 30 | 50.81 | 23757 | 1e+06 |
| ABC033 | C9 | 33(1,C9) | X33 | plate1 | 40.0 | 163.88850 | 0.0061017 | 30 | 50.81 | 23757 | 1e+06 |
| ABC034 | C10 | 34(1,C10) | X34 | plate1 | 23.0 | 22.42919 | 0.0445848 | 30 | 50.81 | 23757 | 1e+06 |
| ABC035 | C11 | 35(1,C11) | X35 | plate1 | 32.0 | 86.11941 | 0.0116118 | 30 | 50.81 | 23757 | 1e+06 |
| ABC036 | C12 | 36(1,C12) | X36 | plate1 | 26.0 | 39.94789 | 0.0250326 | 30 | 50.81 | 23757 | 1e+06 |
| ABC037 | D1 | 37(1,D1) | X37 | plate1 | 32.5 | 90.51282 | 0.0110482 | 30 | 50.81 | 23757 | 1e+06 |
| ABC038 | D2 | 38(1,D2) | X38 | plate1 | 34.0 | 104.11519 | 0.0096047 | 30 | 50.81 | 23757 | 1e+06 |
| ABC039 | D3 | 39(1,D3) | X39 | plate1 | 25.5 | 36.73449 | 0.0272224 | 30 | 50.81 | 23757 | 1e+06 |
| ABC040 | D4 | 40(1,D4) | X40 | plate1 | 35.0 | 113.51335 | 0.0088095 | 30 | 50.81 | 23757 | 1e+06 |
| ABC041 | D5 | 41(1,D5) | X41 | plate1 | 73.5 | 574.06219 | 0.0017420 | 30 | 50.81 | 23757 | 1e+06 |
| ABC042 | D6 | 42(1,D6) | X42 | plate1 | 22.0 | 17.59682 | 0.0568284 | 30 | 50.81 | 23757 | 1e+06 |
| ABC043 | D7 | 43(1,D7) | X43 | plate1 | 28.5 | 57.58667 | 0.0173651 | 30 | 50.81 | 23757 | 1e+06 |
| ABC044 | D8 | 44(1,D8) | X44 | plate1 | 35.5 | 118.30521 | 0.0084527 | 30 | 50.81 | 23757 | 1e+06 |
| ABC045 | D9 | 45(1,D9) | X45 | plate1 | 24.0 | 27.78459 | 0.0359912 | 30 | 50.81 | 23757 | 1e+06 |
| ABC046 | D10 | 46(1,D10) | X46 | plate1 | 98.0 | 898.22021 | 0.0011133 | 30 | 50.81 | 23757 | 1e+06 |
| ABC047 | D11 | 47(1,D11) | X47 | plate1 | 26.0 | 39.94789 | 0.0250326 | 30 | 50.81 | 23757 | 1e+06 |
| ABC048 | D12 | 48(1,D12) | X48 | plate1 | 33.0 | 94.97809 | 0.0105287 | 30 | 50.81 | 23757 | 1e+06 |
| ABC049 | E1 | 49(1,E1) | X49 | plate1 | 25.5 | 36.73449 | 0.0272224 | 30 | 50.81 | 23757 | 1e+06 |
| ABC050 | E2 | 50(1,E2) | X50 | plate1 | 32.0 | 86.11941 | 0.0116118 | 30 | 50.81 | 23757 | 1e+06 |
| ABC051 | E3 | 51(1,E3) | X51 | plate1 | 81.5 | 679.38238 | 0.0014719 | 30 | 50.81 | 23757 | 1e+06 |
| ABC052 | E4 | 52(1,E4) | X52 | plate1 | 29.5 | 65.31595 | 0.0153102 | 30 | 50.81 | 23757 | 1e+06 |
| ABC053 | E5 | 53(1,E5) | X53 | plate1 | 25.0 | 33.63378 | 0.0297320 | 30 | 50.81 | 23757 | 1e+06 |
| ABC054 | E6 | 54(1,E6) | X54 | plate1 | 42.0 | 185.37435 | 0.0053945 | 30 | 50.81 | 23757 | 1e+06 |
| ABC055 | E7 | 55(1,E7) | X55 | plate1 | 46.5 | 235.91408 | 0.0042388 | 30 | 50.81 | 23757 | 1e+06 |
| ABC056 | E8 | 56(1,E8) | X56 | plate1 | 29.0 | 61.40623 | 0.0162850 | 30 | 50.81 | 23757 | 1e+06 |
| ABC057 | E9 | 57(1,E9) | X57 | plate1 | 24.0 | 27.78459 | 0.0359912 | 30 | 50.81 | 23757 | 1e+06 |
| ABC058 | E10 | 58(1,E10) | X58 | plate1 | 37.0 | 133.02904 | 0.0075172 | 30 | 50.81 | 23757 | 1e+06 |
| ABC059 | E11 | 59(1,E11) | X59 | plate1 | 37.5 | 138.04707 | 0.0072439 | 30 | 50.81 | 23757 | 1e+06 |
| ABC060 | E12 | 60(1,E12) | X60 | plate1 | 32.5 | 90.51282 | 0.0110482 | 30 | 50.81 | 23757 | 1e+06 |
| ABC061 | F1 | 61(1,F1) | X61 | plate1 | 25.5 | 36.73449 | 0.0272224 | 30 | 50.81 | 23757 | 1e+06 |
| ABC062 | F2 | 62(1,F2) | X62 | plate1 | 33.5 | 99.51295 | 0.0100489 | 30 | 50.81 | 23757 | 1e+06 |
| ABC063 | F3 | 63(1,F3) | X63 | plate1 | 31.0 | 77.55774 | 0.0128936 | 30 | 50.81 | 23757 | 1e+06 |
| ABC064 | F4 | 64(1,F4) | X64 | plate1 | 36.5 | 128.06489 | 0.0078085 | 30 | 50.81 | 23757 | 1e+06 |
| ABC065 | F5 | 65(1,F5) | X65 | plate1 | 22.0 | 17.59682 | 0.0568284 | 30 | 50.81 | 23757 | 1e+06 |
| ABC066 | F6 | 66(1,F6) | X66 | plate1 | 39.0 | 153.40789 | 0.0065186 | 30 | 50.81 | 23757 | 1e+06 |
| ABC067 | F7 | 67(1,F7) | X67 | plate1 | 37.5 | 138.04707 | 0.0072439 | 30 | 50.81 | 23757 | 1e+06 |
| ABC068 | F8 | 68(1,F8) | X68 | plate1 | 36.0 | 123.15635 | 0.0081198 | 30 | 50.81 | 23757 | 1e+06 |
| ABC069 | F9 | 69(1,F9) | X69 | plate1 | 22.0 | 17.59682 | 0.0568284 | 30 | 50.81 | 23757 | 1e+06 |
| ABC070 | F10 | 70(1,F10) | X70 | plate1 | 30.0 | 69.31294 | 0.0144273 | 30 | 50.81 | 23757 | 1e+06 |
| ABC071 | F11 | 71(1,F11) | X71 | plate1 | 32.0 | 86.11941 | 0.0116118 | 30 | 50.81 | 23757 | 1e+06 |
| ABC072 | F12 | 72(1,F12) | X72 | plate1 | 26.0 | 39.94789 | 0.0250326 | 30 | 50.81 | 23757 | 1e+06 |
| ABC073 | G1 | 73(1,G1) | X73 | plate1 | 25.5 | 36.73449 | 0.0272224 | 30 | 50.81 | 23757 | 1e+06 |
| ABC074 | G2 | 74(1,G2) | X74 | plate1 | 28.5 | 57.58667 | 0.0173651 | 30 | 50.81 | 23757 | 1e+06 |
| ABC075 | G3 | 75(1,G3) | X75 | plate1 | 31.0 | 77.55774 | 0.0128936 | 30 | 50.81 | 23757 | 1e+06 |
| ABC076 | G4 | 76(1,G4) | X76 | plate1 | 30.0 | 69.31294 | 0.0144273 | 30 | 50.81 | 23757 | 1e+06 |
| ABC077 | G5 | 77(1,G5) | X77 | plate1 | 27.0 | 46.69897 | 0.0214137 | 30 | 50.81 | 23757 | 1e+06 |
| ABC078 | G6 | 78(1,G6) | X78 | plate1 | 33.0 | 94.97809 | 0.0105287 | 30 | 50.81 | 23757 | 1e+06 |
| ABC079 | G7 | 79(1,G7) | X79 | plate1 | 27.5 | 50.22995 | 0.0199084 | 30 | 50.81 | 23757 | 1e+06 |
| ABC080 | G8 | 80(1,G8) | X80 | plate1 | 36.0 | 123.15635 | 0.0081198 | 30 | 50.81 | 23757 | 1e+06 |
| ABC081 | G9 | 81(1,G9) | X81 | plate1 | 22.0 | 17.59682 | 0.0568284 | 30 | 50.81 | 23757 | 1e+06 |
| ABC082 | G10 | 82(1,G10) | X82 | plate1 | 30.0 | 69.31294 | 0.0144273 | 30 | 50.81 | 23757 | 1e+06 |
| ABC083 | G11 | 83(1,G11) | X83 | plate1 | 24.5 | 30.64928 | 0.0326272 | 30 | 50.81 | 23757 | 1e+06 |
| ABC084 | G12 | 84(1,G12) | X84 | plate1 | 31.0 | 77.55774 | 0.0128936 | 30 | 50.81 | 23757 | 1e+06 |
| ABC085 | H1 | 85(1,H1) | X85 | plate1 | 26.5 | 43.27051 | 0.0231104 | 30 | 50.81 | 23757 | 1e+06 |
| ABC086 | H2 | 86(1,H2) | X86 | plate1 | 32.0 | 86.11941 | 0.0116118 | 30 | 50.81 | 23757 | 1e+06 |
| ABC087 | H3 | 87(1,H3) | X87 | plate1 | 26.0 | 39.94789 | 0.0250326 | 30 | 50.81 | 23757 | 1e+06 |
| ABC088 | H4 | 88(1,H4) | X88 | plate1 | 35.0 | 113.51335 | 0.0088095 | 30 | 50.81 | 23757 | 1e+06 |
| ABC089 | H5 | 89(1,H5) | X89 | plate1 | 24.0 | 27.78459 | 0.0359912 | 30 | 50.81 | 23757 | 1e+06 |
| ABC090 | H6 | 90(1,H6) | X90 | plate1 | 64.0 | 450.84806 | 0.0022180 | 30 | 50.81 | 23757 | 1e+06 |
| ABC091 | H7 | 91(1,H7) | X91 | plate1 | 33.5 | 99.51295 | 0.0100489 | 30 | 50.81 | 23757 | 1e+06 |
| ABC092 | H8 | 92(1,H8) | X92 | plate1 | 31.5 | 81.80024 | 0.0122249 | 30 | 50.81 | 23757 | 1e+06 |
| ABC093 | H9 | 93(1,H9) | X93 | plate1 | 27.0 | 46.69897 | 0.0214137 | 30 | 50.81 | 23757 | 1e+06 |
| ABC094 | H10 | 94(1,H10) | X94 | plate1 | 24.0 | 27.78459 | 0.0359912 | 30 | 50.81 | 23757 | 1e+06 |
| ABC095 | H11 | 95(1,H11) | X95 | plate1 | 34.5 | 108.78268 | 0.0091926 | 30 | 50.81 | 23757 | 1e+06 |
| ABC096 | H12 | 96(1,H12) | X96 | plate1 | 27.5 | 50.22995 | 0.0199084 | 30 | 50.81 | 23757 | 1e+06 |
For more information on how to visualise MFI and RAU data, see the MFI and RAU plots page.
3.5 Data Analysis: Run Pipeline
runLDHpipeline(
  raw_data = your_raw_LDH_data,
  plate_layout = your_LDH_plate_layout,
  platform = "bioplex",                               # Defaults to "bioplex" but "magpix" or "intelliflex" also works
  file_path = NULL                                    # Defaults to current folder/working directory
)