library(SeroTrackR)
library(tidyverse)

your_raw_data <- c(
  system.file("extdata", "example_MAGPIX_plate1.csv", package = "SeroTrackR"),
  system.file("extdata", "example_MAGPIX_plate2.csv", package = "SeroTrackR"),
  system.file("extdata", "example_MAGPIX_plate3.csv", package = "SeroTrackR")
)
your_plate_layout <- system.file("extdata", "example_platelayout_1.xlsx", package = "SeroTrackR")

sero_data <- readSeroData(
  raw_data = your_raw_data,
  platform = "magpix",        # default
  version = "4.2"             # default
)

plate_list <- readPlateLayout(
  plate_layout = your_plate_layout,
  sero_data  = sero_data
)

qc_results  <- runQC(
  sero_data = sero_data,       # load in your serological data variable
  plate_list = plate_list      # load your plate list variable
)5 Bead Counts
5.1 Visualising Bead Counts
This tutorial focuses on creating plots to visualise the bead counts from your Luminex experimental data.
5.1.1 Setup
5.1.2 Plot Bead Counts
The plotCounts() function provides a summary of the bead counts for each plate well are displayed, with blue indicating there are sufficient beads (≥15) or red when there are not enough. If any of the wells are red, they should be double-checked manually and re-run on a new plate if required.
plotCounts(qc_results, experiment_name = "experiment1")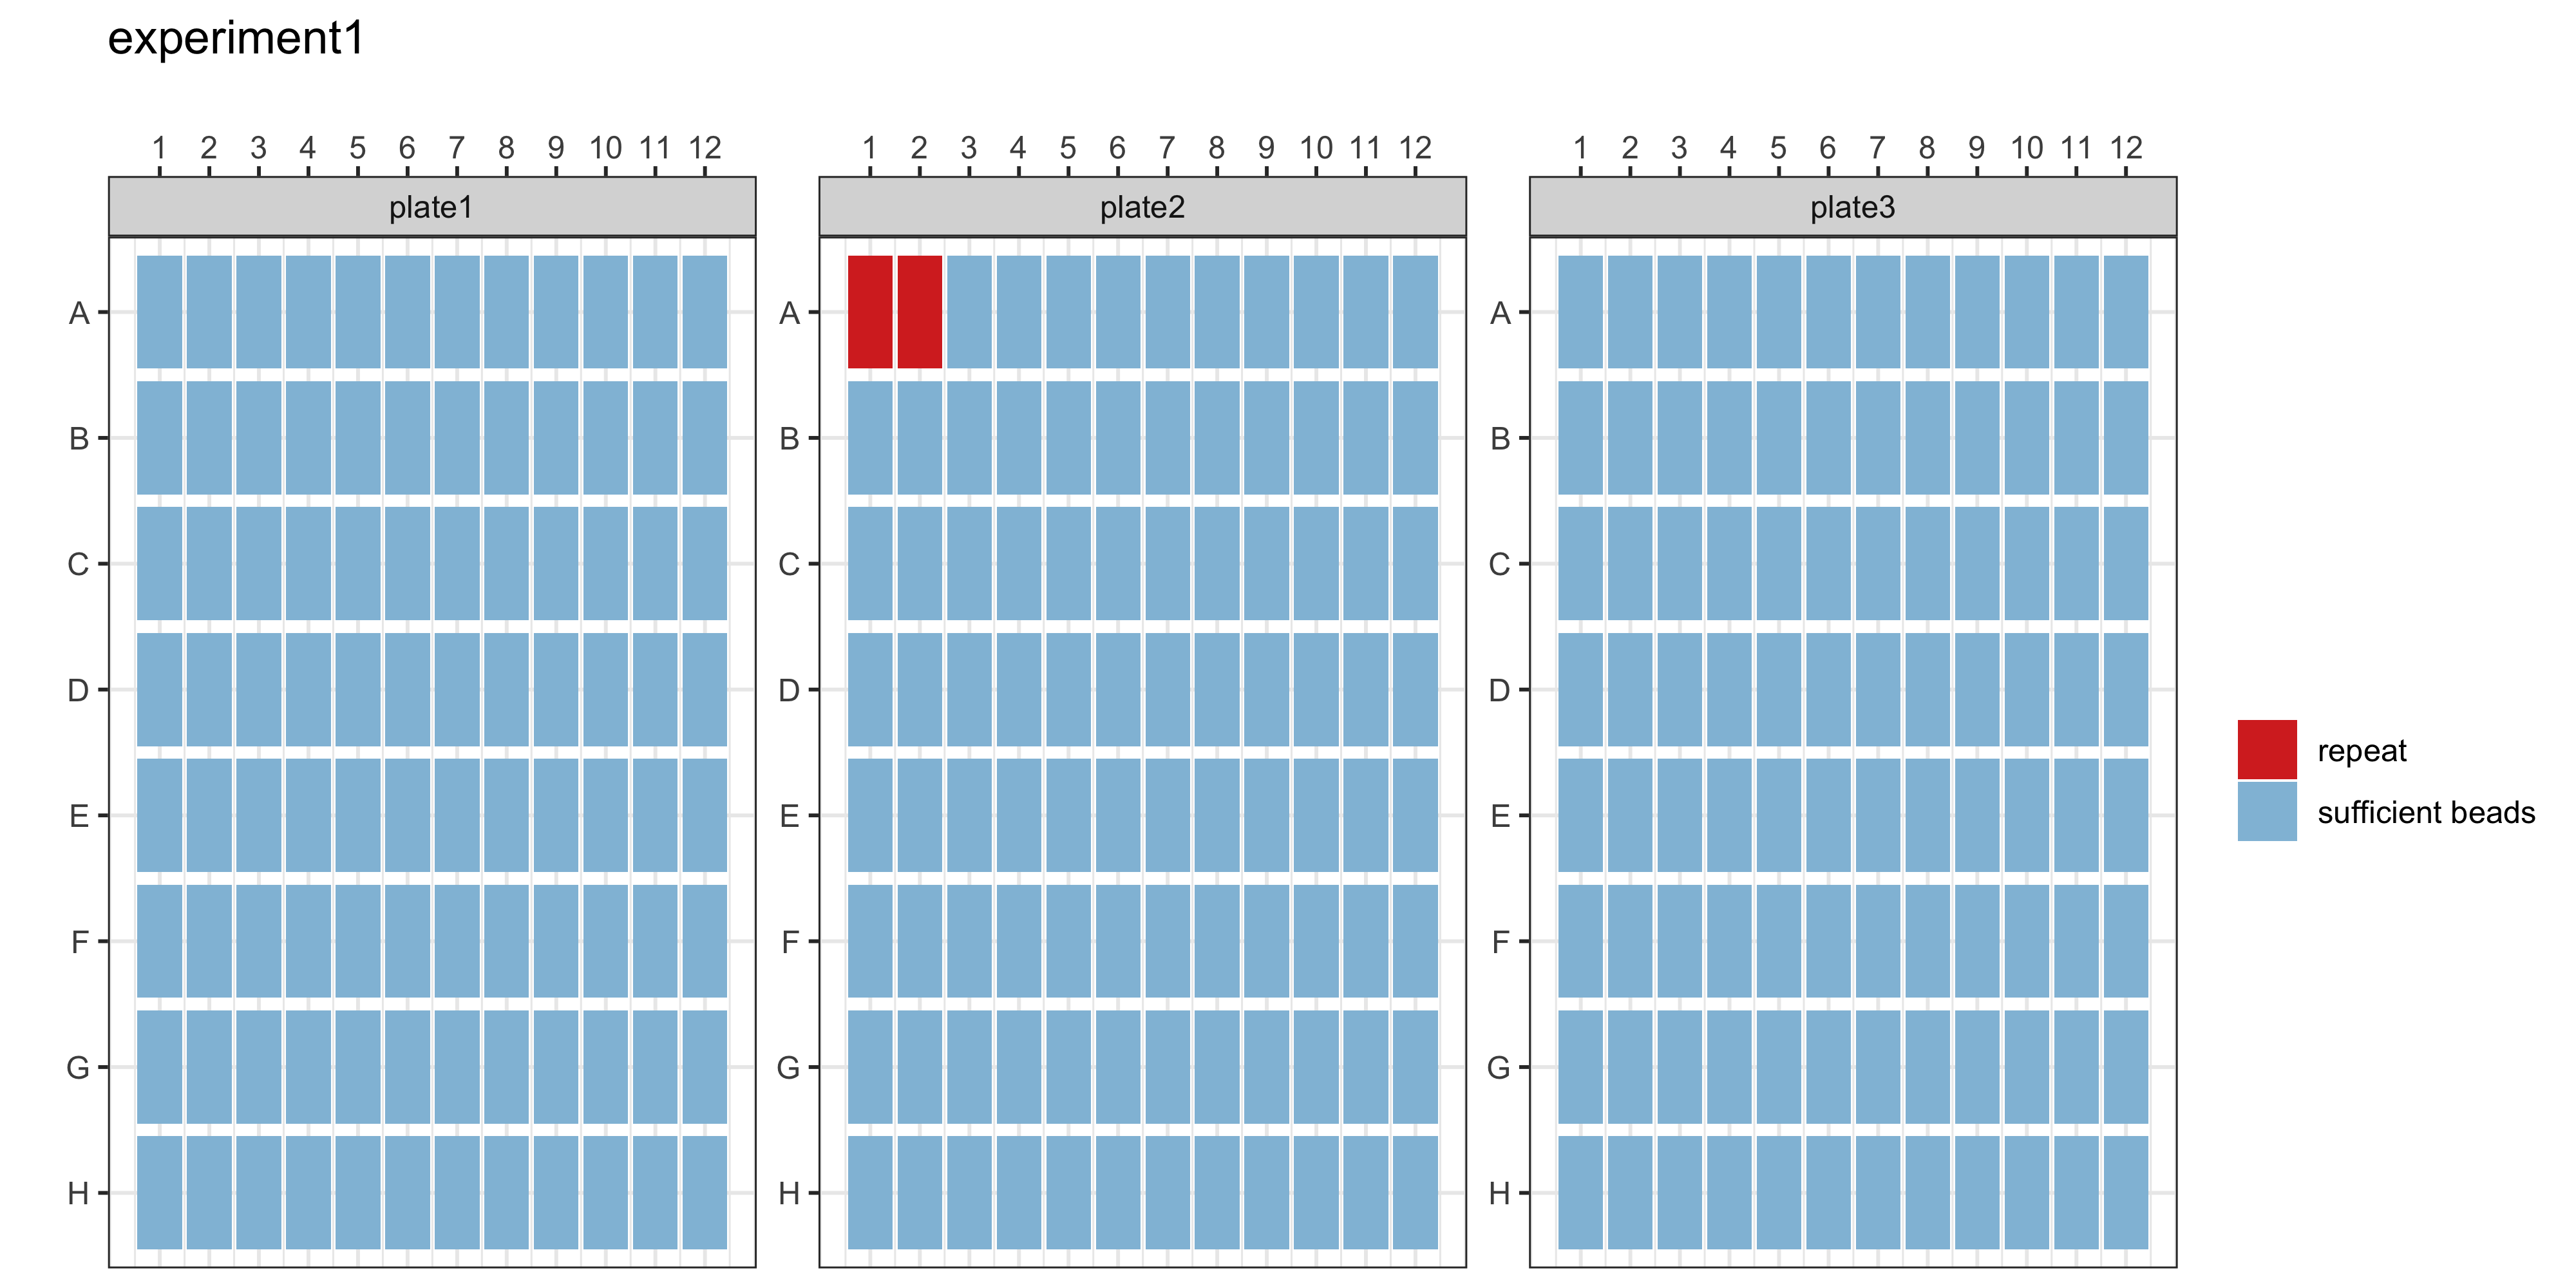
getRepeats(qc_results, plate_list)The getRepeats() function will inform you whether there are “No repeats necessary” or provide a list of samples to be re-run. In the example data, the beads in plate 2 wells A1 and A2 will need to be repeated.
| Location | SampleID | Plate | QC |
|---|---|---|---|
| A1 | Blank1 | plate2 | fail |
| A2 | Blank2 | plate2 | fail |
5.1.3 Plot Bead Counts per Antigen
This dot plot shows the raw bead counts for each antigen in each plate. This is intended as a quality control check to be able to identify which bead may be an issue.
plotBeadCounts(qc_results)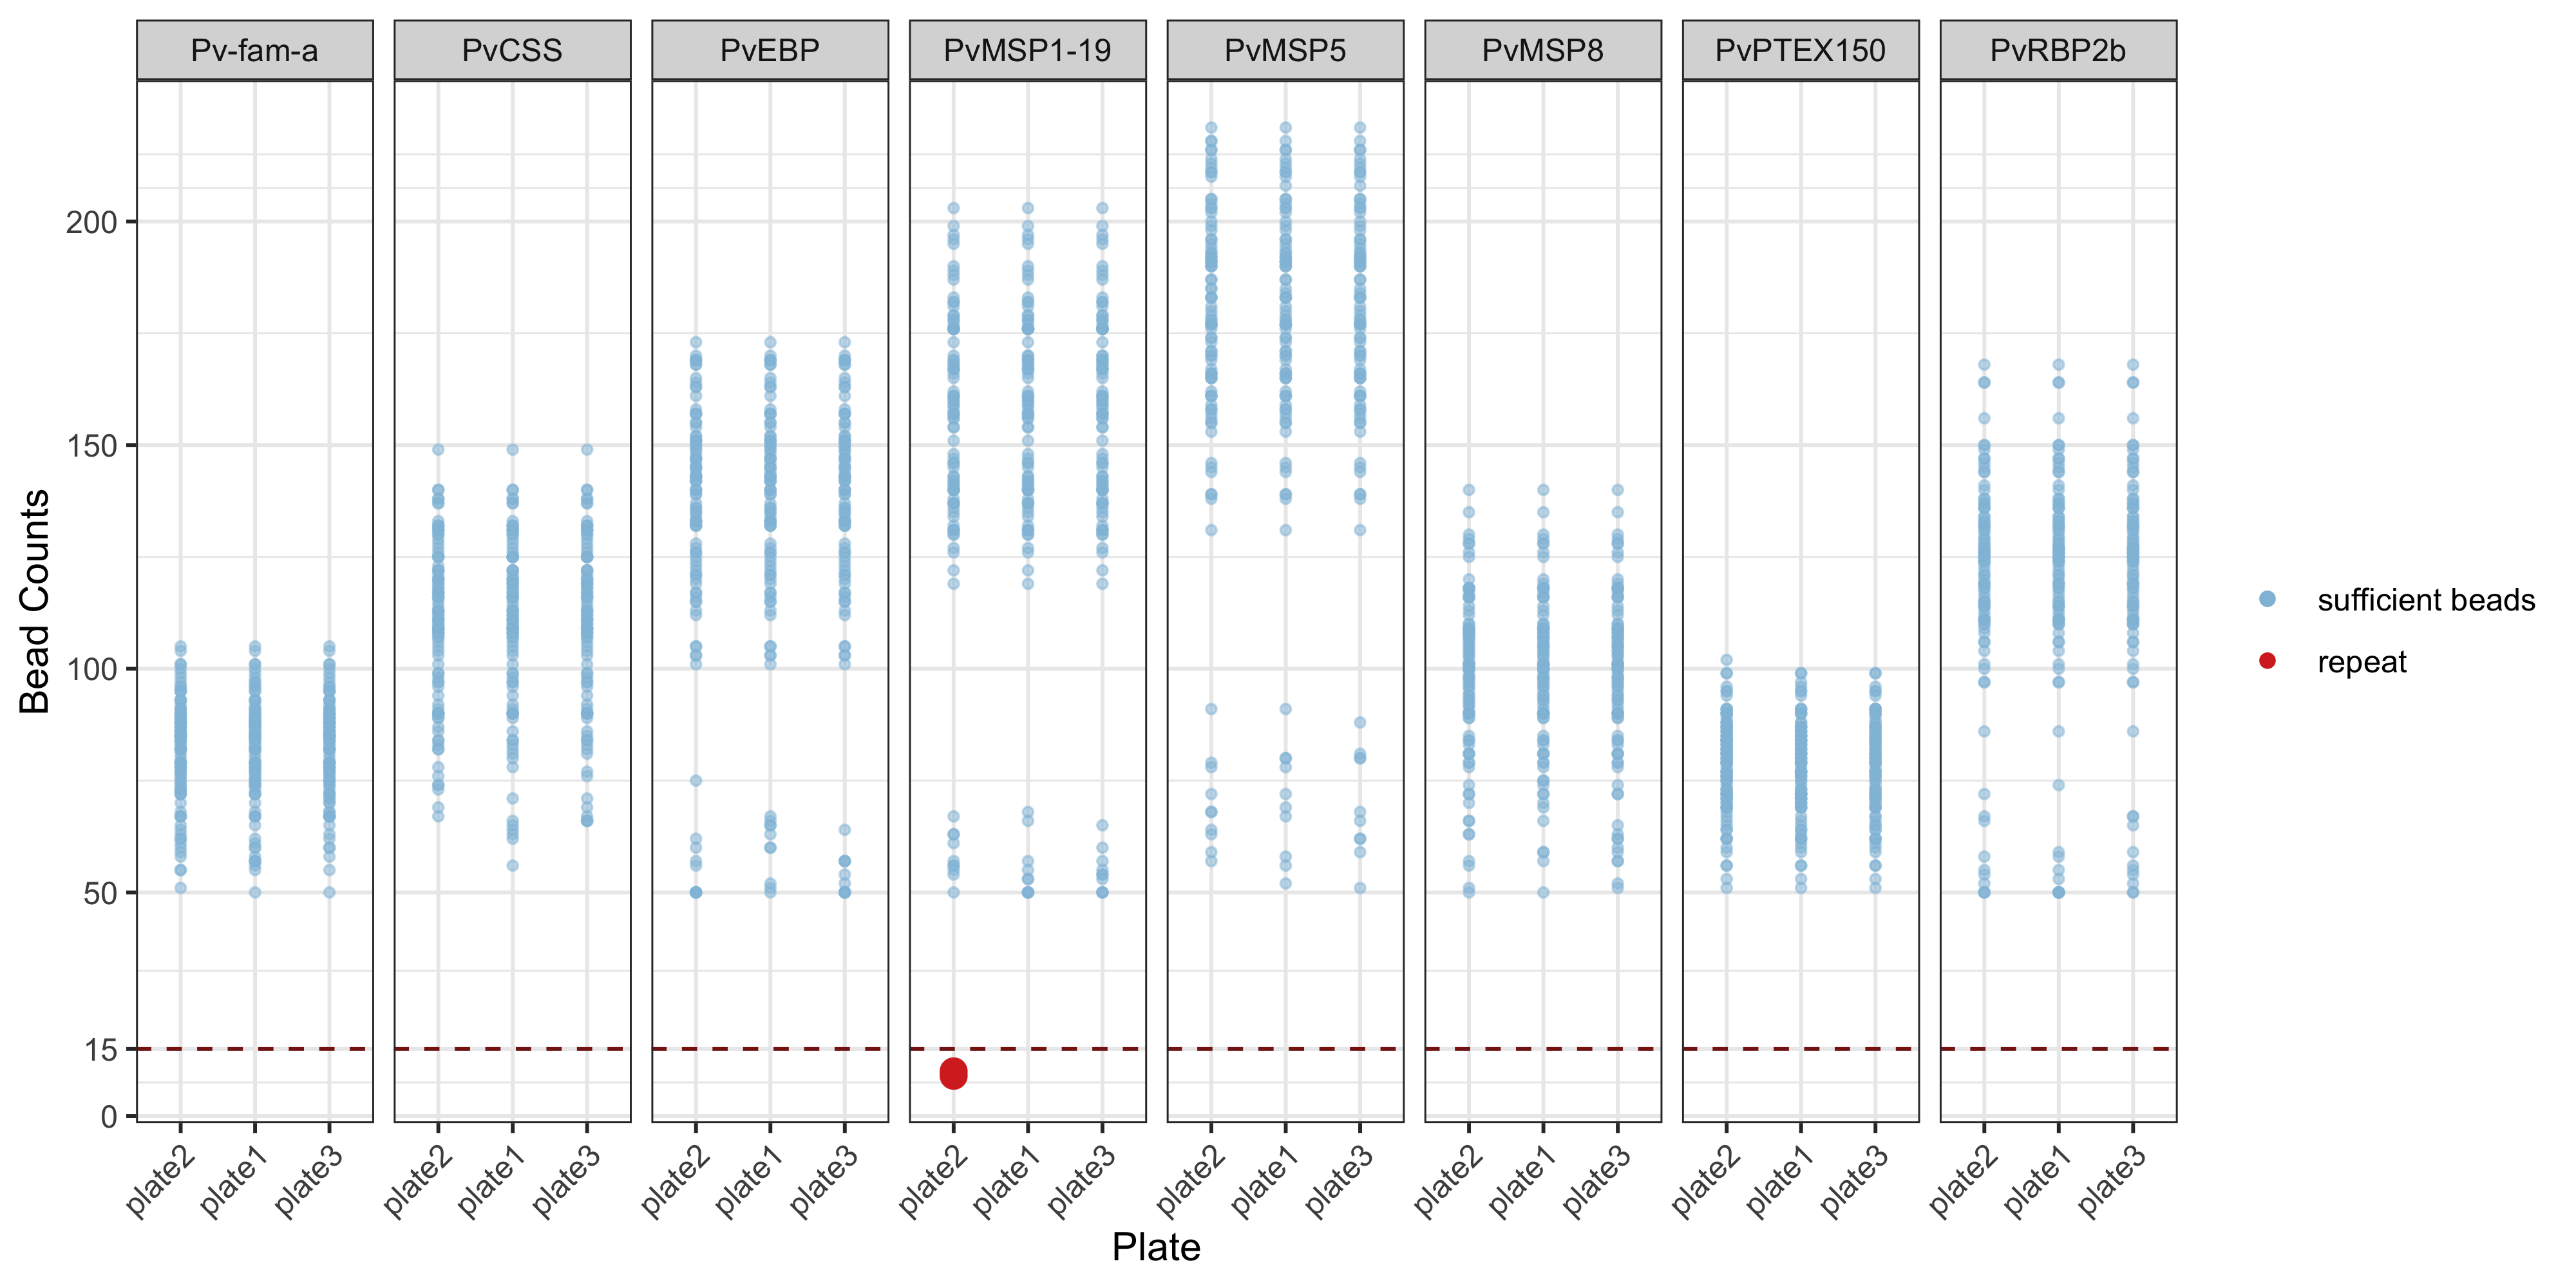
5.2 Customisations
For more customisations on how to manipulate your ggplot2 see the manual here or the book (Wickham 2016).